



Data & Statistical Tools
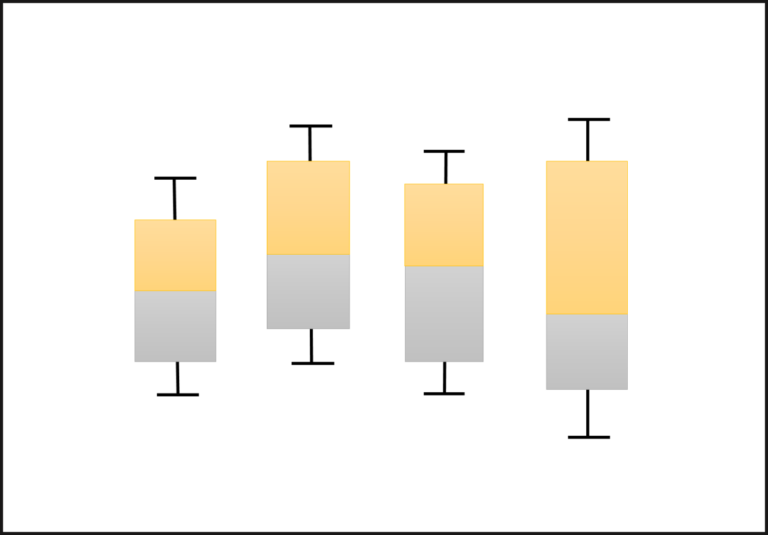
Box and Whisker Plot, Purpose, Drawing Techniques, advantages
Data visualization is a powerful tool for understanding and interpreting complex information. One such visualization method widely used in statistical analysis is the box and

Data & Statistical Tools
Check Sheet in Lean Six Sigma, Types and Benefits
In the world of quality management, Lean Six Sigma has emerged as a robust methodology that aims to eliminate waste, reduce variation, and improve overall efficiency. Within

Data & Statistical Tools
Control Chart: Benefits, Types and Utilization of control chart
Control charts are an essential tool in the world of Lean Six Sigma. These charts help businesses track and analyze data over time, allowing them to

Data & Statistical Tools
Data Collection and Analysis Tools in Lean Six Sigma: A Comprehensive Guide.
Data collection and analysis tools play a crucial role in the success of Lean Six Sigma projects. However, for many practitioners, the realm of data can be

Data & Statistical Tools
Design of Experiments (DOE) : Examples and Applications
Design of Experiments (DOE) is a powerful statistical tool that has revolutionized the way experiments are conducted and analyzed across various fields. Whether you are
Data & Statistical Tools
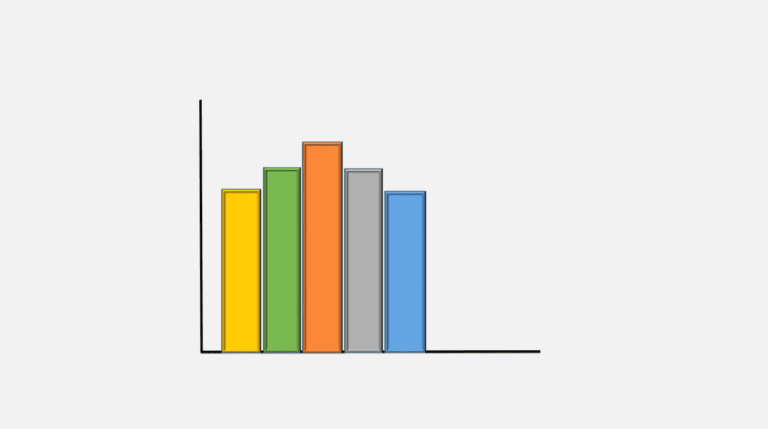
Histogram Mastery: A Comprehensive Guide
Histograms are a powerful visual tool in various fields, from data analysis to photography. They provide a clear and concise representation of a distribution, allowing
Data & Statistical Tools
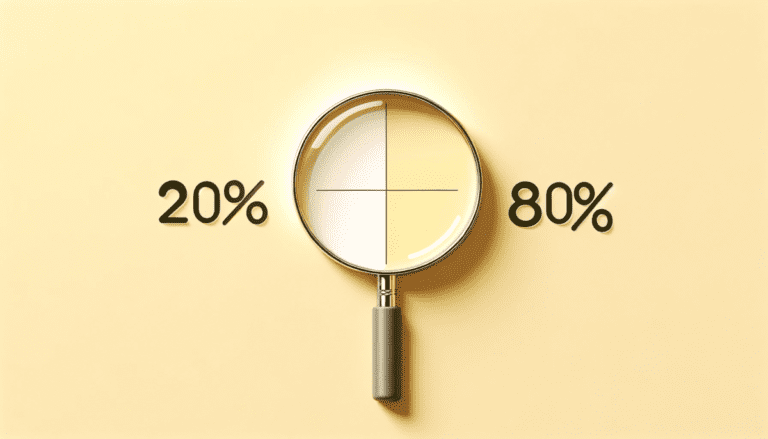
Pareto Chart: Applications and Example
Data analysis is a fundamental aspect of decision-making in various industries. One powerful tool that can significantly enhance your data analysis skills is the Pareto

Data & Statistical Tools
Scatter Diagram: Purpose & Examples
Scatter diagrams, also known as scatter plots, are powerful tools that provide valuable insights into the relationship between two variables. Whether you’re a student learning

Data & Statistical Tools
STRATIFICATION-PROCEDURE & EXAMPLE
Stratification is a statistical technique that allows us to analyze data more accurately. However, many people find this method confusing and intimidating, often avoiding its
Data & Statistical Tools
Survey: A Guide to Data Collection Survey
In this data-driven age, gathering valuable information is crucial for businesses and organizations to make informed decisions. Surveys have proven to be a powerful tool