
Control charts are an essential tool in the world of Lean Six Sigma. These charts help businesses track and analyze data over time, allowing them to identify and address variations in their processes. However, mastering control charts can be daunting for those new to Lean Six Sigma. We have created this comprehensive guide to help you understand, create, and utilize control charts effectively. Whether you’re a beginner looking to gain a solid foundation or an experienced professional aiming to enhance your skills, this guide will provide you with the knowledge and practical tips needed to become a control chart expert. Join us as we dive deep into the world of control charts and unlock their power in improving process performance and achieving operational excellence.
Control Chart
Control charts are also known as Shewhart charts or statistical process control charts
A control chart is an essential tool in identifying variation and deviations from the expected or desired outcomes. At its core, a control chart is a graphical representation of data collected over time. It allows you to analyze and visualize process performance by plotting data points against control limits, which are statistical boundaries that define the acceptable range of variation. By monitoring data points on the control chart, you can detect patterns, trends, or outliers indicating process instability or potential problems.
A variety of industries can utilize this versatile data collection and analysis tool, and it is recognized as one of the seven basic quality tools.
Benefits of Control Chart:
- Control chart offers objective insights into process performance.
- Helps to distinguish between common cause variation (inherent and expected) and particular cause variation (abnormal, needing investigation).
- Identify if a process is in control (stable) or out of control (requiring corrective action).
- Understanding process variation helps minimize defects, reduce waste, and enhance quality.
- Promote accountability and transparency within organizations.
- Provide visual representation for accessible communication with stakeholders.
- Facilitate effective communication and collaboration among teams.
- A vital tool for identifying variation, detecting process problems, and driving continuous improvement.
Different types of Control Chart:
Understanding the different types of control charts is essential for mastering control charts in Lean Six Sigma. Control charts are powerful tools that help monitor process performance and identify variations or trends that may affect quality. Several control charts are designed to analyze different data types and address specific quality concerns.
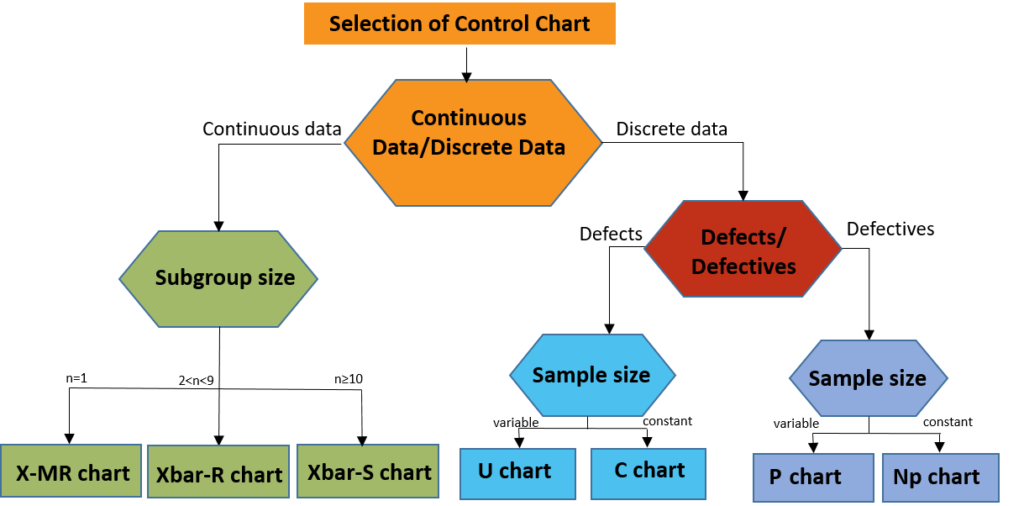
X-Bar and R Chart:
X-Bar and R chart is commonly used to monitor a process’s central tendency and dispersion. The X-bar chart tracks the average value of a sample taken at regular intervals, while the R chart measures the range or variation within each sample. These charts are ideal for continuous data and are especially effective in detecting process mean or variability shifts.
X-MR Chart:
An Individuals and Moving Range (X-MR) chart consists of two control charts designed for processes where each subgroup has only one data point. These charts assess whether a process is consistent and predictable, providing a visual representation of how the system evolves. The Individual (X) chart presents individual measurements, while the Moving Range (MR) chart illustrates the variability between consecutive data points. Additionally, Individuals and Moving Range charts are tools for tracking the impact of process improvement strategies.
X-Bar and S Chart:
X-bar and S-charts are commonly employed control charts for monitoring process mean and standard deviation trends over time. These charts are handy when dealing with subgroups that have large sample sizes. In contrast, S charts offer a more detailed insight into the subgroup data dispersion than range charts.
X-Bar and S charts share similarities with X-Bar and R Control charts. The primary distinction is that X-Bar and S charts display the subgroup standard deviation, while R charts illustrate the subgroup range.
P, Np, C, and U Chart:
These control charts are designed explicitly for attribute data, which involves counting the number of defects or occurrences in a sample. The p chart monitors the proportion of defective items, and the np chart tracks the number of defective items in a fixed sample size. The critical difference between the P and Np charts lies in their applicability to varying sample sizes. The P chart is suitable when sample sizes change, whereas the Np chart is employed when the sample size remains constant.
The c chart counts the number of defects per unit, and the u chart measures the average number per unit. These charts are valuable in analyzing discrete data and evaluating process stability. A C control chart is utilized when dealing with a consistent sample size in the presence of multiple defects. Conversely, U Control Charts are employed when there are multiple defects and a variable sample size.
How to create a Control Chart step-by-step?
Creating a control chart is a manageable process when broken down into these critical steps:
1. Define Data Collection: Determine what data to collect, such as measurements or counts.
2. Collect Data: Gather accurate data over time.
3. Calculate Mean and Deviation: Compute the mean and standard deviation.
4. Plot Data Points: Create a graph with time on the x-axis and collected data on the y-axis.
5. Set Control Limits: Establish upper and lower control limits based on the mean and deviation.
6. Plot Control Limits: Add horizontal lines representing control limits on the chart.
7. Analyze Data: Monitor the process for patterns or points outside control limits.
8. Take Corrective Actions: Address out-of-control points to eliminate root causes.
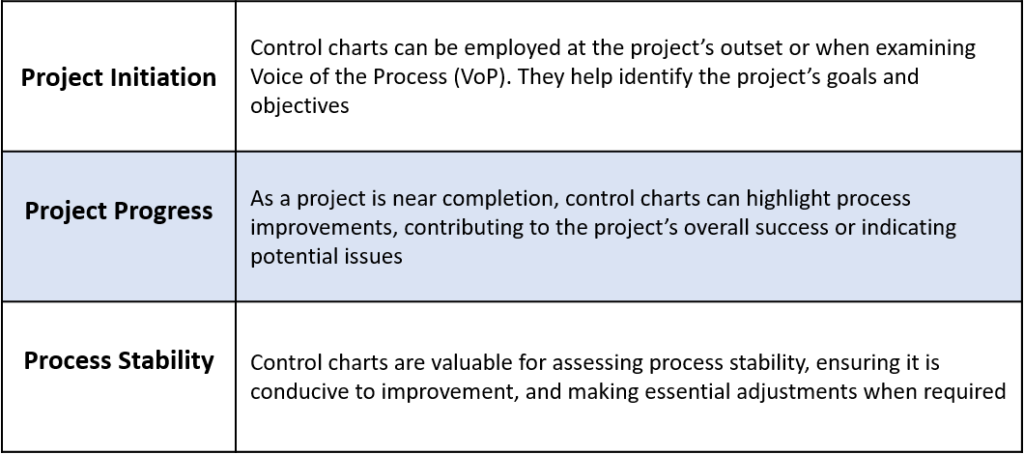
When to Utilize a Control Chart:
Control charts serve various purposes throughout a project lifecycle:
Four Process States in a Control Chart:
There are four distinct process states in a control chart:
- The Ideal State
This represents a process entirely in control, with all data points falling within the established control limits. It signifies a state of perfect conformance with no non-conformance issues.
- The Threshold State
The process remains stable in this state, and data points are generally within control limits. However, occasional instances of non-conformance are observed over time.
- The Brink of Chaos State
Here, the process is technically in control, but it teeters on the edge of making errors. While it has yet to result in non-conformance, it is precarious.
- The Out of Control State
The fourth stage occurs when the process has gone out of control, leading to unpredictable and unmanageable non-conformance. This represents a situation where corrective action is urgently required to restore stability.
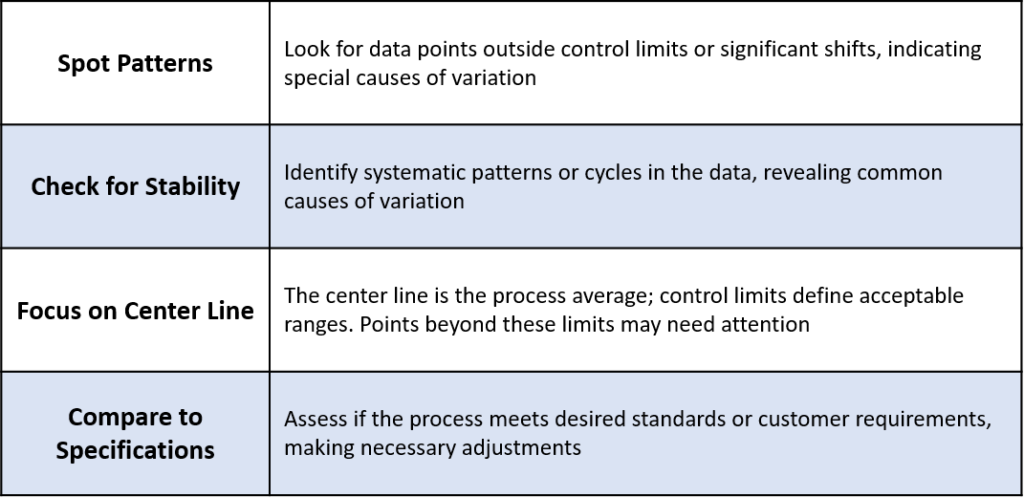
Interpreting Control Chart data:
Analyzing control chart data is a vital step in mastering control charts. Here is how:
Conclusion
In conclusion, control charts are indispensable tools in Lean Six Sigma, enabling organizations to monitor, analyze, and enhance process performance effectively. They provide insights into process stability, identify variations, and guide data-driven decision-making. By understanding the different types of control charts and following a step-by-step approach, organizations can harness the power of control charts to achieve higher levels of quality, efficiency, and customer satisfaction throughout their projects and processes.