
In the world of quality management, Lean Six Sigma has emerged as a robust methodology that aims to eliminate waste, reduce variation, and improve overall efficiency. Within this methodology, a wide range of tools and techniques can help organizations to achieve their quality goals. One such tool is the check sheet, a simple yet effective data collection and analysis tool. In this extensive guide, we will explore the concept of check sheets in Lean Six Sigma, and understand their purpose. Whether you are new to Lean Six Sigma or looking to enhance your understanding of quality tools, this guide will provide the information and understanding required to harness the complete capabilities of check sheets in your organization’s quality improvement efforts.
Check Sheet:
A check sheet, also known as a defect concentration diagram, is a simple and structured data collection tool used in various quality improvement methodologies, including Lean and Six Sigma. It is designed to help organizations collect, organize, and analyze data systematically and efficiently.
Check sheet is considered one of the seven fundamental quality tools, this is a versatile data collection and analysis tool that can be adapted for a wide range of purposes.
Benefits of Check Sheet:
Here are the key characteristics and benefits of check sheets:
- Collects and organizes data
- Systematic and efficient
- Identifies patterns and trends
- Helps in quality control- Versatile for different data types
- Tracks defects, errors, feedback, and variables
- Facilitates data visualization
- Enhances understanding through graphs
- Establishes baseline for future comparison
- Promotes continuous improvement and sustainable success
Types of Check Sheet:
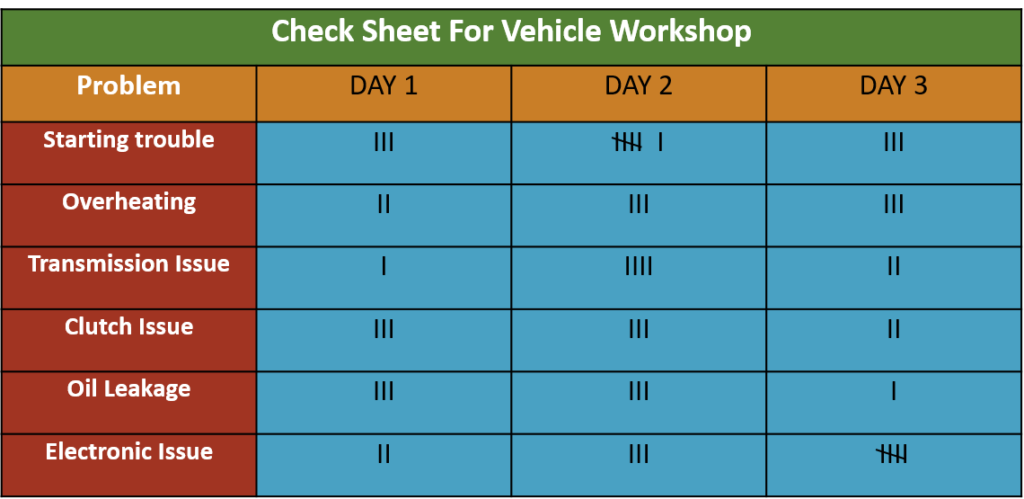
1. Tabular Check Sheet:
The tabular check sheet is a practical tool for collecting quality concerns and occurrences data. It is beneficial in scenarios where you must determine the frequency of specific events, such as mishaps during laboratory studies. This check sheet facilitates organized data collection and subsequent analysis by structuring data in a tabular format, making it an essential component in quality improvement processes.
2. Process Probability Distribution Check Sheet:
The process probability distribution check sheet becomes invaluable when measuring a process’s performance and seeking primary frequency distribution data. Its primary function is visually representing the probabilistic distribution of various process execution components. With a glance at this check sheet, you can gain insights into the process’s performance. Establishing appropriate upper and lower limits according to specifications is essential to ensure accurate data representation.
3. Defect Type Check Sheet:
Managing flaws within your processes becomes more efficient when you can categorize them based on factors like the type of defect and its occurrence frequency. The defect-type check sheet is designed precisely for this purpose, allowing for the easy counting and subsequent analysis of the incidence of specific faults. It provides a snapshot of the current problems within your project, which can be further analyzed using statistical tools.
4. Defect Cause Sheet:
Similar in structure to the defect type sheet, the defect cause sheet focuses on identifying the root causes of problems within a process. While only sometimes critical information, it can be invaluable when conducting root cause analyses or similar investigations in the future. By documenting the causes of each problem, you create a foundation for effectively addressing and preventing these issues.
5. Location Sheet:
The location sheet takes a more visual approach to data collection. It often employs pictorial representations, allowing users to mark specific issue’s positions or locations. For instance, in a vehicle’s bodywork, one can use this sheet to indicate damages and dents by marking them on a corresponding image. This visual representation simplifies the identification and tracking of issues based on their physical locations.
6. Graphical Sheet:
A graphical sheet is a powerful tool for collecting and examining data distribution. Observers can better understand how data is dispersed through visual representations like charts, graphs, and histograms. This visual approach enhances data analysis and interpretation, making identifying trends, patterns, and anomalies within the dataset easier. The graphical sheet’s visual aids can provide valuable insights for decision-making and process improvement initiatives.
Check Sheet Format:
While we have the flexibility to tailor a check sheet to our specific requirements, it is crucial to ensure that it is meticulously crafted to suit its intended purpose. An adequately designed check sheet should address inquiries regarding the issue’s quantity and location, the execution of inspections, and more. Some essential components typically incorporated into the format include:
1. Operator’s name.
2. Nature of the data being gathered.
3. Where the data collection occurred.
4. Timetables for data collection.
5. The rationale behind data collection.
Step-by-step guide to creating a Check Sheet:
1. Determine the specific event or issue for observation and establish clear operational definitions.
2. Define the timing and duration for data collection.
3. Create a user-friendly form that enables users to quickly record data with checkmarks, Xs, or similar symbols, eliminating the need for data duplication.
4. Label every space on the form appropriately.
5. Pilot-test the check sheet to confirm its suitability for collecting the correct data and user-friendliness.
6. Record data on the check sheet each time the targeted event or problem occurs.
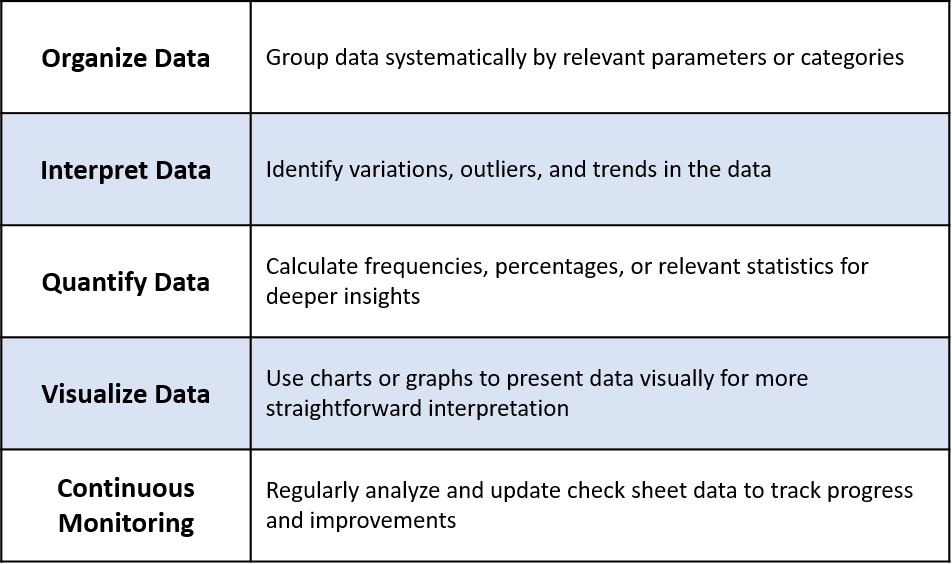
Analyzing and interpreting data from Check Sheet:
FAQS
What is the difference between a Check Sheet and Checklist?
Check Sheets and Checklists serve distinct purposes in various fields, each contributing to efficient processes and quality control.
Check Sheets are primarily designed to record and organize observations. They excel in tracking the frequency of specific events and identifying patterns and trends, making them valuable data collection and analysis tools. They are commonly employed in Lean Six Sigma methodologies and other data-driven processes. Additionally, Check Sheets are often used for defect tracking, helping organizations pinpoint and address issues.
On the other hand, Checklists are essential for preventing errors during multi-step procedures by ensuring step-by-step accuracy. They are instrumental in guaranteeing completeness and correctness in tasks and processes. Checklists are commonly utilized in auditing, quality control, and various procedural workflows to ensure adherence to specified steps and guidelines. They are particularly effective in finding and preventing errors before they occur.
In summary, while both Check Sheets and Checklists contribute to process optimization, Check Sheets are data-focused tools that aid in observation, trend identification, and defect tracking. In contrast, Checklists are task-oriented tools that enhance accuracy, completeness, and error prevention during procedural workflows.
Conclusion
In short, quality improvement methodologies like Lean and Six Sigma utilize a valuable data collection tool known as a Check Sheet. It systematically collects and organizes data, identifies patterns and trends, tracks defects and errors, and facilitates data visualization. There are various types of Check Sheets, including tabular, process probability distribution, defect type, defect cause, location, and graphical sheets, each designed for specific purposes. Creating a practical Check Sheet involves defining the event or issue, designing a user-friendly form, and pilot-testing it for suitability. Analyzing data from Check Sheets involves organizing, interpreting, quantifying, and visualizing the data, enabling continuous monitoring and improvement efforts in quality projects.