Stratification is a statistical technique that allows us to analyze data more accurately. However, many people find this method confusing and intimidating, often avoiding its use altogether. In this blog post, we aim to demystify stratification and provide you with a comprehensive guide on when and how to use it effectively. We will explain the step-by-step procedure, discuss its benefits and limitations, and provide real-life examples to illustrate its application. By the end of this article, you will have a clear understanding of stratification and be equipped with the knowledge to confidently apply it to your own research or data analysis projects.
WHAT IS STRATIFICATION?
Stratification involves organizing data, individuals, or objects into distinct categories or layers, so that patterns can be seen. It is often used alongside other data analysis tools to enhance understanding. It is hard to find important information when data from different sources or categories are mixed up. Stratification helps in segregating this data, making it easier to identify patterns. Recognized as one of the seven basic quality tools, it’s crucial in data analysis.
WHEN TO USE STRATIFICATION?
- Prior to data collection
- When dealing with data from multiple sources or under different conditions, like varying shifts, days, suppliers, or demographic groups
- Essential when different data sources or conditions need to be analyzed separately
Examples of data sources that might need stratification include:
- Types of equipment
- Various work shifts
- Different departments
- Varied materials used
- Multiple suppliers
- Specific days of the week
- Times of day
- Range of products
STRATIFICATION PROCEDURE
1. Identify Key Data Source Characteristics: Before collecting data, determine which aspects of the data sources might influence the results. Plan to capture these details during data collection.
2. Use Markings for Data Analysis: In analysis tools like scatter diagrams, control charts, or histograms, use different marks or colors to separate data from various sources. This method, known as stratification, helps distinguish the data sets visually.
3. Analyze Each Data Subset Separate: Analyze stratified data sets individually. For example, in a scatter diagram with data from two sources, assess each source independently by drawing quadrants, counting points, and determining critical values.
4. Compare Stratified Data: After individual analysis, compare the findings across different stratified groups to uncover trends or discrepancies not visible in aggregated data.
5. Inform Decisions with Stratified Insights: Use the insights from the stratified analysis to make informed decisions. Stratification can reveal specific trends or issues pertinent to particular data sources, guiding more targeted actions or improvements.
STRATIFICATION EXAMPLE
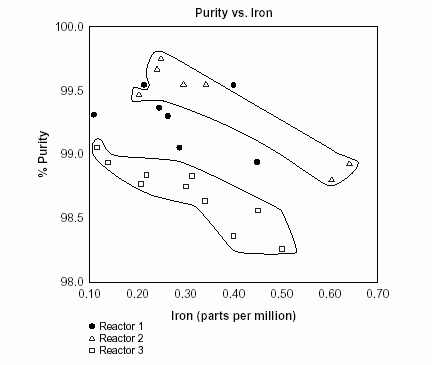
A team initially created a scatter diagram to examine the potential relationship between product purity and iron contamination, but the plot did not reveal any clear connection. Subsequently, a team member recognized that the data originated from three distinct reactors. To gain deeper insights, the team member reconfigured the diagram, assigning different symbols for each reactor’s data.

In the above diagram, distinctive patterns are emerged. The data points from reactor 2 and reactor 3, highlighted with circles, indicate a noticeable trend, purity tends to decrease as iron contamination increases. Remarkably, this relationship is not observed in the data from reactor 1, represented by solid dots that are not circled. This difference suggests that something unique or different exists in the data from reactor 1.
STRATIFICATION ANALYSIS CONSIDERATIONS
- Stratification greatly benefits survey data analysis
- Decide on stratification before data collection and plan for relevant detail gathering
- Include a clear legend in charts and graphs to explain stratification marks or colors
- Consider segmenting data for unique insights
- Balance detail with clarity in stratified data presentation
- Use stratification to reveal hidden patterns in data
- Ensure stratified data is easily understandable for all stakeholders
- Regularly review stratification strategies for optimal results
CONCLUSION
In summary, stratification is a really useful method in data analysis. It helps break down complex data into easier-to-understand groups, making it easier to spot specific trends and patterns. This approach is especially helpful in areas like market research or quality checks. The key to its effectiveness is how it can be adapted to different kinds of data and goals. When used carefully, stratification makes understanding data simpler and helps make better decisions. It shows just how important it is to organize and look at data in a structured way to get useful insights.


