In today’s competitive business landscape, finding ways to optimize efficiency and drive profitability is crucial for success. Lean methodologies have gained significant traction in various industries, offering a systematic approach to eliminate waste and enhance processes. One such powerful tool is Value Stream Mapping (VSM), which allows organizations to visualize and analyze their entire workflow, from raw materials to the final product or service delivery. By identifying areas of waste, bottlenecks, and opportunities for improvement, companies can unlock untapped potential for increased efficiency and profitability. In this blog post, we will explore the profitable applications of Lean Value Stream Mapping and how it can revolutionize your business operations.
What is Value Stream Mapping (VSM)?
Value Stream Mapping (VSM) is a powerful tool used in lean management to identify and eliminate waste in a process or system. It is a visual representation of the flow of materials, information, and activities from the beginning to the end of a process.
VSM employs a flowchart that maps out each step in the value stream, including inputs, outputs, and the time required for each activity. This helps identify bottlenecks, redundancies, and waste areas in the process. VSM also considers customer requirements and expectations, ensuring the value stream is aligned with customer needs.
History of Value Stream Mapping
Although perceived as relatively new, VSM has roots tracing back over 30 years to a visual mapping technique employed by the Toyota Motor Corporation. Termed initially “material and information flow,” it emerged from Toyota’s efforts to comprehend the flow of materials and information within their organization. The method gained popularity in the United States as American companies observed the efficiency of Toyota’s operations.
The term “Value Stream” was introduced in the book “The Machine that Changed the World“ (1990) and further popularized in “Lean Thinking“ (1996), both by James Womack and Daniel Jones. These publications played a pivotal role in launching the Lean movement, defining the value stream as the sequence of activities undertaken by an organization to fulfill a customer request.
Initially developed by Toyota, the original VSM template employed material and process flowcharts. This allowed Toyota to gain a comprehensive view of its activities, leading to the removal of nonessential, wasteful activities while maintaining an efficient manufacturing process.
VSM is all about figuring out how to make a product or service better for customers. It’s like asking, “How can we improve what we offer so that it meets what customers really want and need?” By understanding what adds value from the customer’s perspective, one can make their products or services more useful and appealing. This involves enhancing features and functionality without increasing wasted time and materials, aligning with the Japanese term “muda” for waste.
Benefits of Value Stream Mapping
- VSM boosts efficiency and profits by cutting non-value-added activities
- Visual mapping exposes inefficiencies and bottlenecks for targeted improvements
- Streamlining operations reduces waste through workflow redesign and standardized procedures
- Promotes collaboration and cross-functional cooperation
- Results in cost savings by eliminating waste and optimizing resource allocation
- Adapts quickly to changing customer demands by aligning processes accordingly
- Continuous improvement ensures enhanced value to customers
- It drives efficiency, cost reduction, and sustainable success in business
Terminologies and symbol’s meaning
In Value Stream Mapping (VSM), understanding the terminology and symbols is essential, as they convey crucial information. While some features are standardized, it is essential to note that variations may exist to meet specific objectives, making each VSM unique.
Sections:
Information Flow:
Illustrates the communication of process-related information and data transmission. For instance, In a software team, the manager (like a messenger) handles customer requests. If the requests are good to go, they’re sent to development queue.
Product Flow:
Maps the development lifecycle steps, from concept to delivery. It can be tailored to focus on specific process sections, displaying tasks, responsible individuals or teams, and critical process data. Queue status and “Push Arrows” indicate where products move between stages.
Time Ladder:
Provides a visual representation of the value stream timeline, depicting the average time features spent in queues or actively being worked on at each stage.
Terms:
Cycle Time (C/T):
Represents the unit/feature production frequency or the average time between completing one unit/feature and starting the next.
Setup Time (S/T):
Signifies the time required to prepare for a specific step, applicable in software development for tasks like understanding requests or configuring test environments.
Uptime (%):
Indicates the percentage of total time processes or systems are actively operational.
Lead Time:
It calculates the average time for a feature request to go through the entire development cycle.
Takt Time:
Reflects the rate at which products must be produced to meet customer demand.
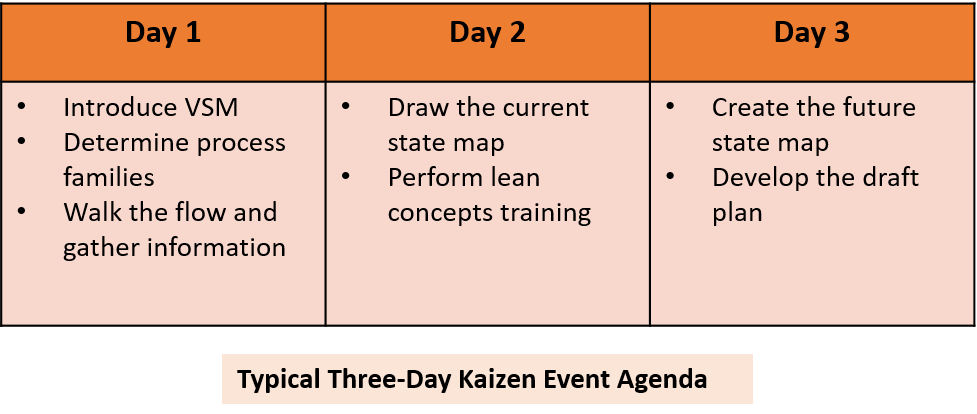
Kaizen Burst:
Also known as Kaizen Blitz refers to a short burst of focused team activity (3-5 days) to resolve specific challenges. It is crucial for achieving tangible solutions and addressing issues not resolved as planned, contributing to performance improvement in the value stream.
Procedure of conducting VSM exercise
Step 1: Define the Scope
Clearly outline the boundaries and processes of the value stream to be mapped.
Step 2: Identify the Current State
Assemble a cross-functional team and document each step of the value stream using symbols for different activities.
Step 3: Calculate Lead Time and Cycle Time
Quantify the total time (lead time) and process-specific time (cycle time) to identify bottlenecks and areas of waste.
Step 4: Identify Value-Added and Non-Value-Added Activities
Analyze the map to distinguish between activities that add value to the customer and non-value-added activities (waste).
Step 5: Design the Future State
Brainstorm with the team to create a future state map, focusing on reducing lead time and cycle time and eliminating non-value-added activities.
Step 6: Implement and Continuously Improve
Develop an action plan for implementing proposed changes, assign responsibilities, set deadlines, and monitor progress.
Note: Value stream mapping is an ongoing process; regularly monitor and adjust to maintain efficiency and profitability.
Common VSM Icons
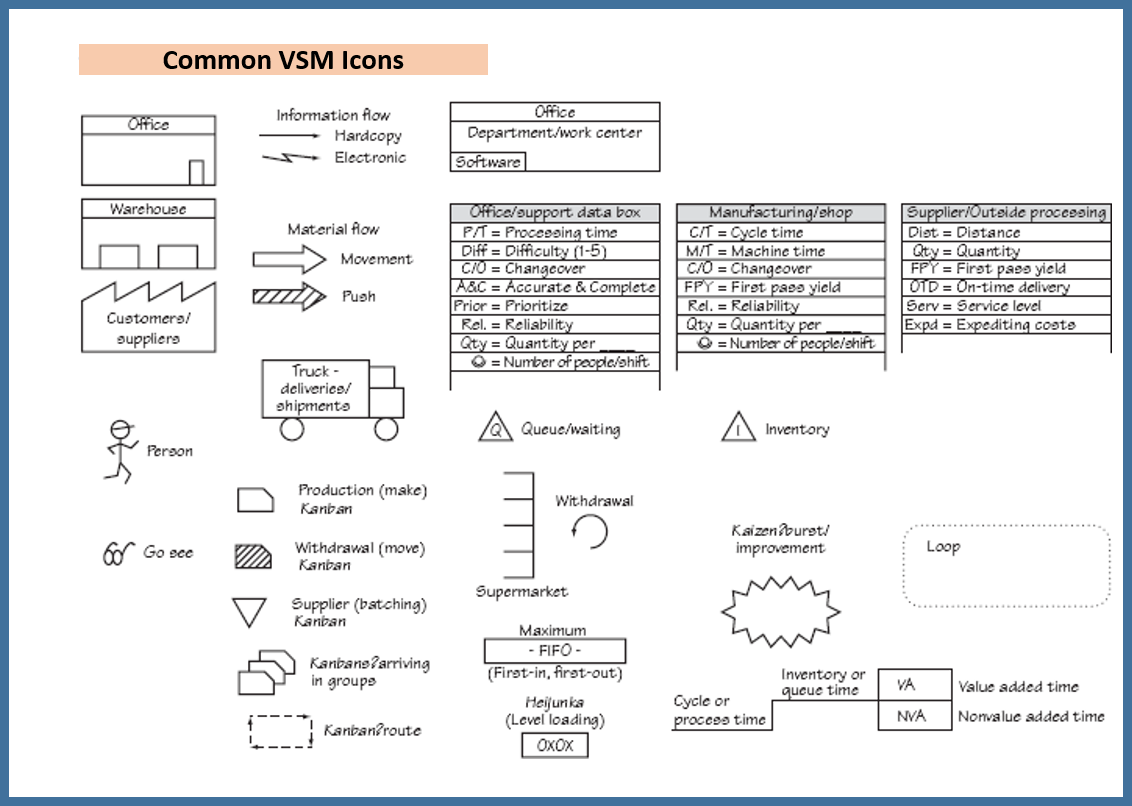
Certain key sections are designated on the map for specific purposes.
- The upper-right corner is reserved for customer information, while the upper-left corner is dedicated to supplier information.
- Information flow is represented in the top half of the paper, whereas material (or product) flow is depicted in the bottom half.
- To assess value, the gutters on the top and bottom are utilized to calculate both value-added and non-value-added time.
- For a comprehensive analysis, the cycle time is compared to the inventory time (in days) for both material and information flow.
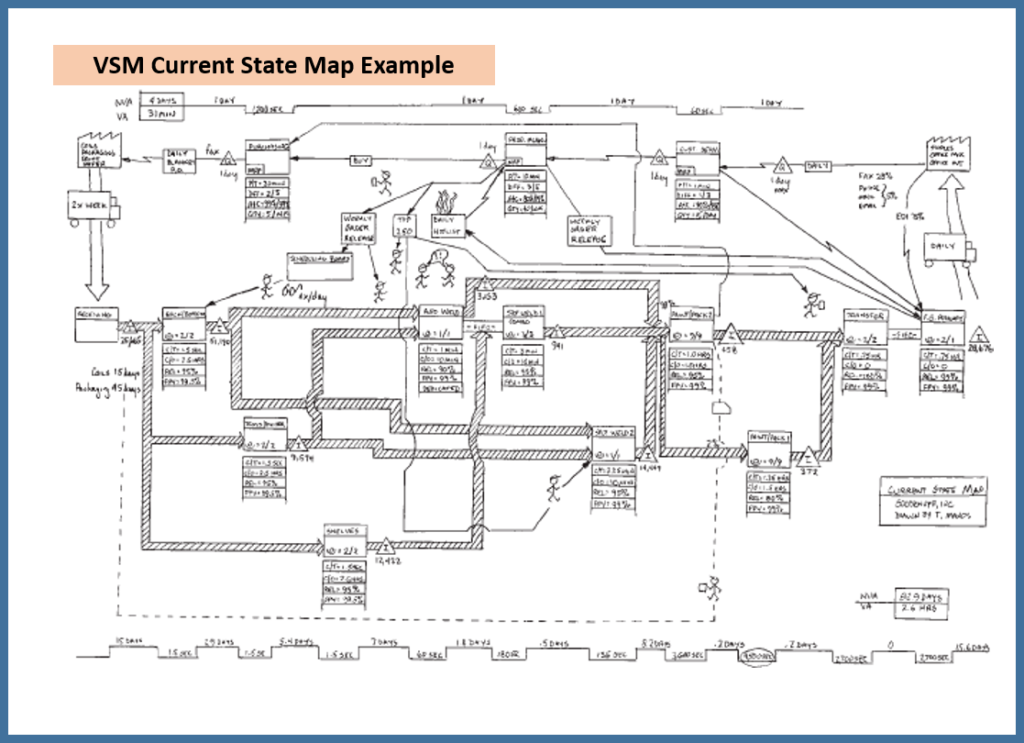
VSM Example
(Current State Map)
It’s important to note that each Value Stream Map (VSM) will vary slightly based on the unique characteristics of the process. The following figure provides an illustrative example of a current state VSM used in the context of a metal fabricating company.
Future State Map
What is Takt Time?
Takt time, derived from the German word for a conductor’s baton, signifies how often a part must be produced to meet customer demand. It is calculated as time available (per shift) divided by demand (per shift).
Identifying Bottlenecks:
Examine cycle or processing times during kaizen. If any surpass the takt time, it may indicate a bottleneck causing overproduction or extra processing.
Reducing Inventory:
Consider controlled inventory systems like supermarkets. Evaluate raw material, work in progress, and finished goods inventories for potential reductions.
Improving Flow:
Explore possibilities for continuous material flow, eliminating stoppages. Establishing a “first in, first out” lane between processes can aid flow.
Additional Improvements:
Assess equipment reliability, first pass yield, and quality levels. Address training needs in 5S and consider layout adjustments. Use kaizen bursts on the VSM to signal areas requiring improvement, such as long changeover times or overproduction.
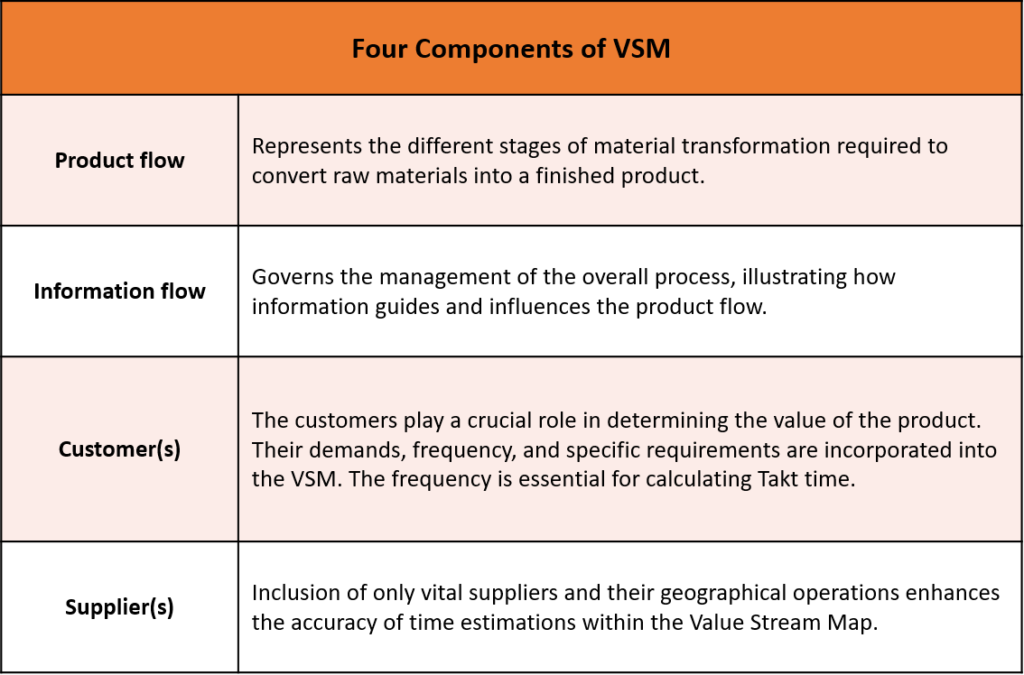
Four components of VSM
Tips for successful VSM
1. Hands-On Experience
Personally follow the entire value stream to gain direct experience. Walk through physical processes, use a stopwatch for timing, and avoid relying solely on assumptions. Ensure that at least one team member covers the entire stream for a comprehensive perspective.
2. Start with a Hand-Drawn Sketch
Begin by sketching the initial VSM by hand in pencil. This allows for a flexible and visual representation of the steps. Later, use chart-drawing software for more transparent communication and collaboration, mapping out a future or ideal state.
3. Initial Walk-Through
Conduct an initial walk-through to experience the value stream at an overview level. Follow up with a more detailed walk to capture details and complexities.
4. Reverse the Process
Consider walking through the value stream in reverse, from the end product or service, and tracing back to its origins. This alternative perspective can provide clarity and deeper insights.
5. Continuous Inquiry with “Why”
Adopt asking “why” repeatedly, known as the Five Whys in Lean Six Sigma. Continuously question the reasons behind each step in the process until reaching the fundamental basis for the action. This helps uncover root causes and essential insights.
Applications of Value Stream Mapping
| Field | Applications of VSM |
|---|---|
| Manufacturing | Offers detailed insight into the conversion process to streamline production |
| Identifies and eliminates waste and non-value services | |
| Supply Chain and Logistics | Identifies time-consuming or costly processes for removal or finding alternatives, reducing waste |
| Software Engineering/Development | Illustrates the journey from idea to implementation |
| Identifies inefficiencies, loopholes, reworks, and incorrect steps in the development process | |
| Service Industries | Uncovers flaws in business flow, enhancing the efficiency of customer delivery |
| Healthcare | Efficiently eliminates unnecessary requirements in the treatment process, benefiting patients and hospitals |
| Office and Administrative | Reduces the time required for actions or completion of requests by speeding up overall workflows |
Conclusion
Value Stream Mapping (VSM) serves as a cornerstone in lean management, offering organizations a potent tool to identify and eliminate waste in their processes. Originating from Toyota’s efficiency-driven methodologies, VSM has evolved into a comprehensive technique for visualizing material, information, and activity flows. Using Lean Value Stream Mapping is like having a valuable tool to make a business better as it ensures continuous improvement and lasting success.


