

When it comes to project management, staying organized and on track is crucial. This is where Gantt charts come into play. Gantt charts are potent tools that visually represent the timeline of a project. While they may seem complex at first glance, understanding the benefits and uses of Gantt charts can greatly enhance your project management skills. This comprehensive guide will demystify Gantt charts, explain their benefits, explore their various applications, and provide a step-by-step guide on creating them. Whether you are a seasoned project manager or just starting, this guide will equip you with the knowledge and skills to effectively utilize Gantt charts in your projects, resulting in improved planning, increased productivity, and successful project completion.
Table of Contents:
2. Why is Gantt chart important?
4. Applications of Gantt charts
5. Step-by-step guide to creating a Gantt chart
7. Example
8. Conclusion
1. What is a Gantt chart?
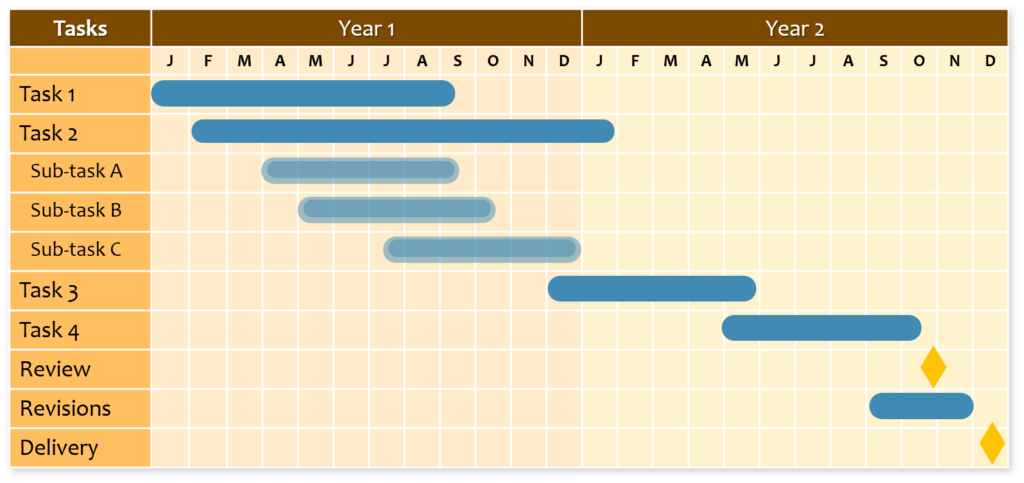
A Gantt chart is a powerful project management tool that visually represents the timeline, tasks, and dependencies of a project. It consists of horizontal bars representing tasks or activities along a vertical timeline. As the project advances, Gantt charts employ shading to indicate completed tasks, and individuals responsible for each task can be depicted on the chart using names or colors. This allows project managers and teams to quickly visualize each task’s start and end dates, as well as their dependencies and overall progress. Gantt chart is also called a milestones chart, activity chart, or project bar chart.
2. Why is Gantt chart important?
- Clear project timeline representation.
- Organized project management and progress tracking.
- Efficient resource allocation and dependency visualization.
- Promote coordination, transparency, and accountability.
- Facilitate communication and decision-making.
- Improve project efficiency for successful outcomes.
3. When to use a Gantt Chart?
- Use Gantt charts for task scheduling and tracking.
- Employ them for clear project communication.
- Apply when steps and durations are known.
- Suitable for projects without complex task dependencies.
- Manage multiple projects simultaneously.
- Optimize resource allocation and prioritize tasks.
4. Applications of Gantt charts
Project Management:
In project management, Gantt charts are vital for breaking down complex projects into manageable tasks and assigning them to team members. This visual representation helps track progress and meet deadlines, allocate resources efficiently, and identify potential bottlenecks for early issue resolution.
Construction Management:
In construction management, Gantt charts provide a clear overview of project timelines, facilitating the coordination of activities and ensuring a smooth workflow. This visual approach enhances transparency and accountability, fostering efficient project execution.
Personal and Academic Planning:
For personal use and academic planning, Gantt charts help individuals and teams visualize steps for reaching personal goals and planning academic schedules. This visual approach enhances organization, task prioritization, and efficient time management.
Marketing Campaigns:
Gantt charts are valuable for orchestrating marketing campaigns. They assist in visualizing the steps involved, enhancing organization, and promoting efficient time management, making them an invaluable tool for marketing professionals.
Diverse and Adaptable:
Gantt charts find versatile applications in various aspects of life and work. Their visual representation simplifies complex processes, fosters accountability, and contributes to the successful management of projects across different domains.
5. Step-by-step guide to creating a Gantt chart
Creating a Gantt chart involves the following steps:
- Define project tasks, list them chronologically, and assign start and end dates.
- Identify significant project milestones by either brainstorming a list or creating a visual representation like a flowchart, or arrow diagram.
- Determine task dependencies to establish the sequence of tasks.
- Estimate task durations realistically.
- Set up your Gantt chart by creating columns for task details.
- Add tasks to the chart, including dates and dependencies.
- Draw a horizontal time axis with an appropriate scale for task durations.
- List tasks and milestones on the left side of the chart.
- For point-in-time events, draw diamonds under the specific time.
- For activities over time, draw bars spanning the start and end times.
- Ensure every project task is included on the chart.
6. Using the Gantt Chart
- As tasks and milestones are completed, fill in diamonds and bars.
- For tasks in progress, estimate the completion percentage and fill in the corresponding portion of the bar.
- Use a vertical marker (e.g., a string) to indicate the current point on the timeline for tracking progress.
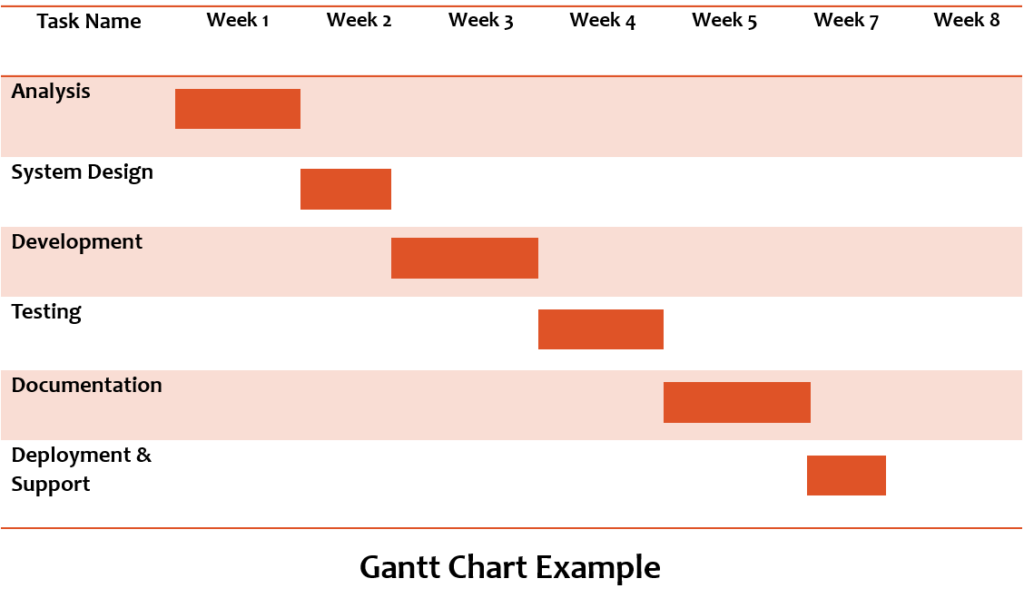
7. Example
Let us take an example of creating a Gantt chart for a Software Development Project:
8. Conclusion
In conclusion, a Gantt chart is a powerful project management tool that clearly represents a project’s timeline, promoting organization, accountability, and efficiency. It is crucial in various domains, from project management to construction, personal planning, and marketing campaigns. By following a step-by-step guide for creating Gantt charts, teams, and individuals can enhance their project management capabilities and improve their chances of achieving successful outcomes. The adaptability and versatility of Gantt charts make them an indispensable asset for those seeking to streamline their projects and enhance overall efficiency in their professional and personal endeavors.