
In the world of process improvement, Lean Six Sigma has become a widely adopted methodology for increasing efficiency and reducing waste. One of the key tools used in Lean Six Sigma is the arrow diagram, a visual representation of the flow of activities within a process. This powerful tool allows organizations to identify bottlenecks, streamline processes, and improve overall productivity. In this blog post, we will explore the power of arrow diagrams in Lean Six Sigma and how they can be utilized to unlock efficiency in your organization. Aditionally, From understanding the basics of arrow diagramming to applying it in real-world scenarios, this comprehensive guide will provide you with the knowledge and insights needed to optimize your processes and achieve peak performance.
Arrow Diagram
An arrow diagram, also called an activity network diagram, arrow network, or activity-on-arrow diagram, represents the sequence of activities within a process, highlighting dependencies and facilitating efficient resource allocation. In Lean Six Sigma, arrow diagrams are constructed by assigning each activity or task a specific arrow, with the direction indicating the flow of work. The arrows are then connected to illustrate the logical relationships and dependencies between activities. This visual representation allows project teams to identify critical paths, bottlenecks, and areas for improvement.
When to use Arrow Diagram
Arrow diagram visually represent the sequence of activities in a process, showing dependencies and aiding resource allocation. They are helpful when you want to:
- Understand process flow and identify inefficiencies.
- Optimize workflow and improve processes.
- Enhance communication and collaboration among teams.
- Allocate resources effectively to minimize delays and ensure optimal utilization.
- Identify and uncover bottlenecks in the processes.
In project management, alternative methods akin to the Arrow Diagram exist to assess the performance of a project. These include:
- Critical Path Method (CPM): A strategic project management tool utilized for planning and supervising a project’s trajectory. It leverages a network diagram to pinpoint essential tasks that need timely completion to ensure the project stays on schedule.
- Program Evaluation and Review Technique (PERT): A technique for managing projects that assesses the required tasks and activities. It employs a network diagram to recognize critical tasks, their interdependencies, and their impact on the project timeline.
- Gantt Charts: Visual displays that outline a project’s schedule and associated tasks. They serve as monitoring tools to track the project’s advancement and to highlight which tasks are necessary for achieving the project’s objectives.
Benefits of Using Arrow Diagram in Lean Six Sigma
Benefits of Arrow Diagram in Lean Six Sigma are as follows:
- Arrow diagrams visually represent the process’s flow of tasks and activities.
- Provide a clear and concise overview of the entire process.
- Identify bottlenecks, redundancies, and improvement opportunities.
- Map out each step and its dependencies to pinpoint delays or inefficiencies.
- Facilitate targeted improvements to streamline the process and reduce waste.
- Engage team members in discussions as the diagram is created.
- Share insights on process optimization.
- Consider all perspectives for more effective solutions.
- Easily update and modify arrow diagrams as the process evolves or new information arises.
- Supports training of new employees for consistent execution of improved processes.
Steps to Create an Effective Arrow Diagram
Creating an effective arrow diagram is crucial in order to unlock efficiency and streamline processes. To achieve this, first follow these steps to create an arrow diagram that accurately represents your workflow and identifies areas for improvement.
Identify the Process
To begin, clearly define the process you wish to diagram. First, understand the inputs, outputs, and activities involved. This will help you gain a comprehensive understanding of the process before creating the diagram.
Determine the Process Steps
Break down the process into individual steps or activities. Begin with the first step and progress sequentially until you reach the end.
Use Arrows to Represent Flow
Utilize arrows to represent the flow of activities between steps. These arrows indicate the direction and order of the activities. Moreover, ensure that the arrows are clear and easy to follow, allowing for a visual representation of the process flow.
Include Decision Points
Furthermore, if there are decision points or branching paths within the process, make sure to include them in your diagram. Decision points are represented by diamond shapes, and arrows will branch out from these points to indicate different paths.
Add Details
Enhance your arrow diagram by including additional details such as timeframes, resources required, or any other relevant information. By doing this, it will provide a more comprehensive view of the process, thereby aiding in identifying areas for improvement.
Validate and Review
Once you have created your arrow diagram, review it to ensure accuracy and completeness. To validate the diagram, engage with process stakeholders to ensure it aligns with their understanding of the process. Indeed, creating an effective arrow diagram is an essential step in unlocking efficiency within Lean Six Sigma. By following these steps, you’ll be able to visually represent the process, identify bottlenecks, and uncover opportunities for improvement
Different types of Arrow Diagram
There are two main types of arrow diagrams used in various situations, one is called the arrow network, or activity on arrow (AoA), and the other is the node network, also known as activity on node (AoN) or a precedence diagram.
Activity On Arrow Diagram (AoA)
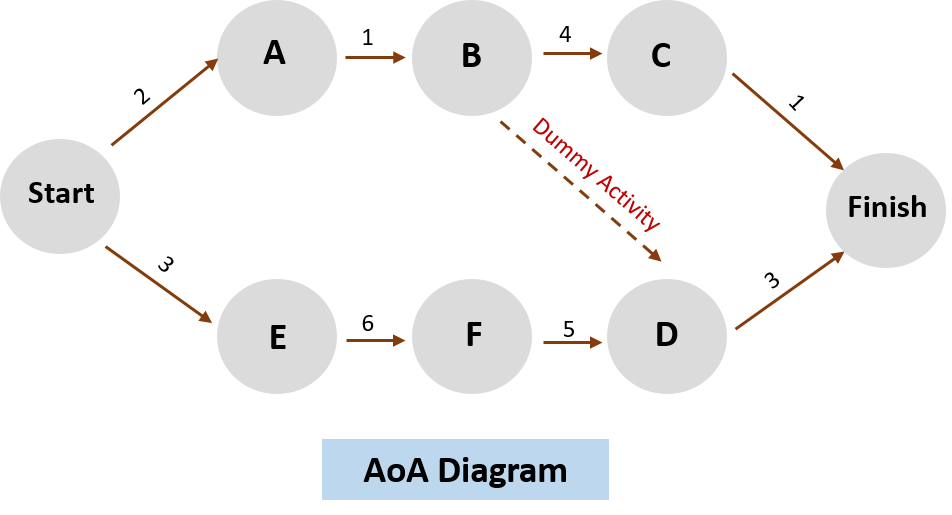
This is the diagram where activities are symbolized by arrows. These arrows are linked together by nodes. The back part of the arrow marks the beginning of the activity, while the pointed end shows its conclusion. The length of the arrow represents how long the activity takes, and it’s drawn to scale on the diagram. Additionally, a dummy task is introduced to symbolize the relationship between the two tasks; however, it does not correspond to an actual task. This kind of diagram only displays the relationships where one activity needs to finish before another can start.
Activity On Node Diagram (AoN)
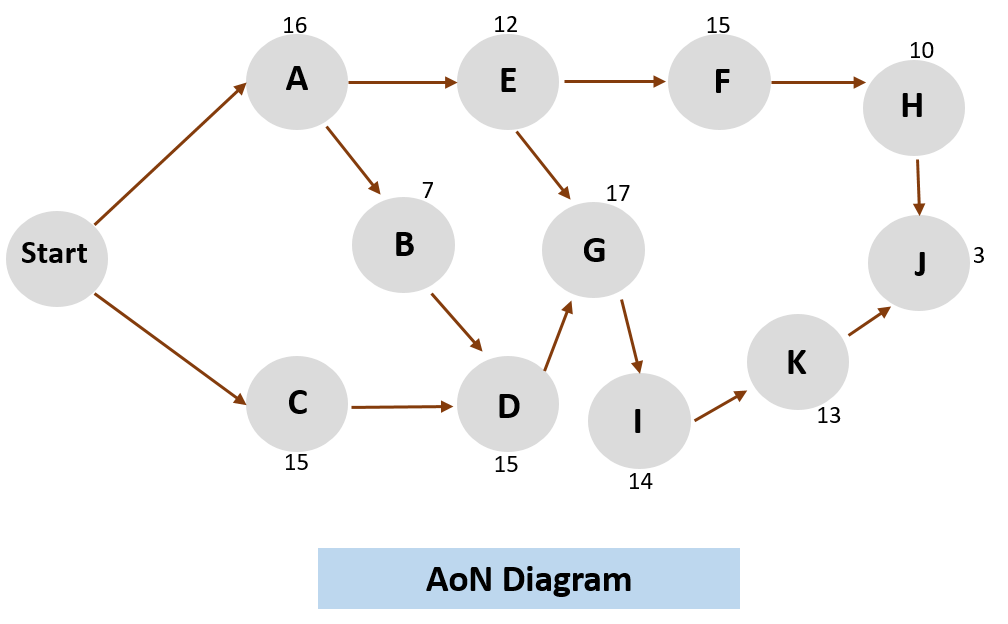
In this particular diagram format, activities are denoted as nodes, and they are linked together by arrows. These arrows serve to illustrate the connections between the activities. What sets this diagram apart is its ability to depict all four types of dependencies: finish-to-start, start-to-start, finish-to-finish, and start-to-finish. Consequently, it provides a comprehensive view of task relationships.
Real-World Applications of Arrow Diagram
Real-World Applications of Arrow Diagrams are as follows:
Project Management
- Critical Path Analysis: Identifies critical tasks and dependencies.
- Resource Allocation: Helps allocate resources effectively.
- Timely Completion: Ensures projects stay on track and meet deadlines.
Supply Chain Management
- Flow Analysis: Examines material, information, and cash flow.
- Optimization: Identifies critical activities and areas for improvement.
- Inventory Management: Enhances inventory control and reduces lead times.
Process Improvement
- Visual Mapping: Represents process steps and activities visually.
- Waste Elimination: Identifies non-value-added activities for removal.
- Efficiency Enhancement: Streamlines operations, reduces cycle times, and improves customer satisfaction.
Quality Control
- Input-Process-Output Mapping: Visualizes quality control processes.
- Root Cause Analysis: Pinpoints the causes of defects and quality issues.
- Corrective Actions: Leads to improved product/service quality and customer experience.
Conclusion
In conclusion, arrow diagrams are indispensable tools within Lean Six Sigma, visually representing process flows, dependencies, and critical paths. These diagrams empower organizations to unlock efficiency by identifying bottlenecks, streamlining processes, and optimizing resource allocation. Whether applied to project management, supply chain optimization, process improvement, or quality control, arrow diagrams provide clarity and insights that lead to enhanced productivity and customer satisfaction. By mastering the creation and utilization of arrow diagrams, organizations can harness their power to drive continuous improvement and achieve peak performance in today’s competitive landscape.