
When it comes to analyzing complex systems and making informed decisions, having a clear visual representation can make all the difference. Interrelationship diagrams is a powerful tool in the field of visual analysis. If you find yourself grappling with intricate relationships and connections between various factors, this blog post is here to demystify interrelationship diagrams and show you when and how to use them effectively. It will equip you with the knowledge and practical tips needed to unlock the potential of interrelationship diagrams for effective visual analysis and decision making.
1. What are interrelationship diagrams?
2. When to use interrelationship diagrams?
3. How to create an interrelationship diagram?
4. Tips for effective decision making with interrelationship diagrams
5. Example
6. Conclusion
1. What are interrelationship diagrams?
Interrelationship diagrams, also known as interrelationship diagraph, relations diagram or digraph, network diagram, are powerful visual tools that help analyze complex relationships and connections between different factors or variables. They are commonly used in problem-solving, decision-making, and strategic planning processes. Interrelationship diagrams are designed to visually represent cause-and-effect relationships among various elements or factors. They provide a structured framework for organizing and understanding the interdependencies between different components of a system or a problem.
The diagram typically consists of a central issue or objective placed at the center, with related factors or variables branching out from it. These factors are then interconnected using arrows or lines to demonstrate the relationships between them. The arrows indicate the direction of influence or impact, showcasing how each factor affects or is influenced by others.
2. When to use interrelationship diagrams?
- Interrelationship diagrams are best for solving complex problems with interconnected variables.
- They are used after creating an affinity diagram, fishbone diagram, or tree diagram to thoroughly examine the connections between ideas.
- They help in root cause identification and relationships between factors in an issue.
- Organize and prioritize ideas during brainstorming sessions.
- Enable more informed decisions by visualizing dependencies and impacts.
- Reveal hidden patterns and connections between variables.
- Enhance efficiency in analyzing complex situations and making decisions.
- Useful in team issues, project challenges, personal dilemmas, and strategic planning.
3. How to create an interrelationship diagram
Problem Identification:
Commence the problem-solving process by clearly defining the issue that needs resolution. Place this problem within a box at the top of your workspace for clarity.
Issue Generation:
Employ brainstorming to generate a comprehensive list of issues, ideas, reasons, and causes related to the identified problem. Dedicate individual rectangles on the page to represent each of these issues.
Establish Connections:
Examine the relationships between the identified issues. Begin with any item and determine if it has a cause-and-effect relationship with another. Utilize arrows to illustrate these relationships, pointing from the cause to the effect.
Intensity Assessment:
Consider the strength of the relationships between issues. For particularly strong connections, use solid arrows, and for weaker relationships, employ dotted lines to differentiate the intensity of influence.
Analysis:
Review the resulting diagram to identify key causes of the problem, which will be items with numerous outgoing arrows, as well as main outcomes, represented by items with multiple arrows pointing towards them.
Issue Resolution:
Focus on addressing the main causes identified in the diagram to formulate effective solutions for the issues at hand.
4. Tips for effective decision making with interrelationship diagrams
- Clearly define the problem or decision at hand.
- Gather relevant data and information about the factors.
- Identify key factors and relationships, using arrows to indicate influence.
- Use clear and concise labels for each factor.
- Involve diverse stakeholders for different perspectives.
- Regularly review and update the diagram.
- Use interrelationship diagrams in conjunction with other methods.
5. Example
Suppose a manufacturing company is experiencing a decrease in product quality. They decide to use an interrelationship diagram to understand the factors affecting this issue. The following factors are included in the analysis:
- Machine Maintenance
- Operator Training
- Raw Material Quality
- Production Speed
- Product Design
- Inspection Procedures
- Employee Morale
- Supplier Quality
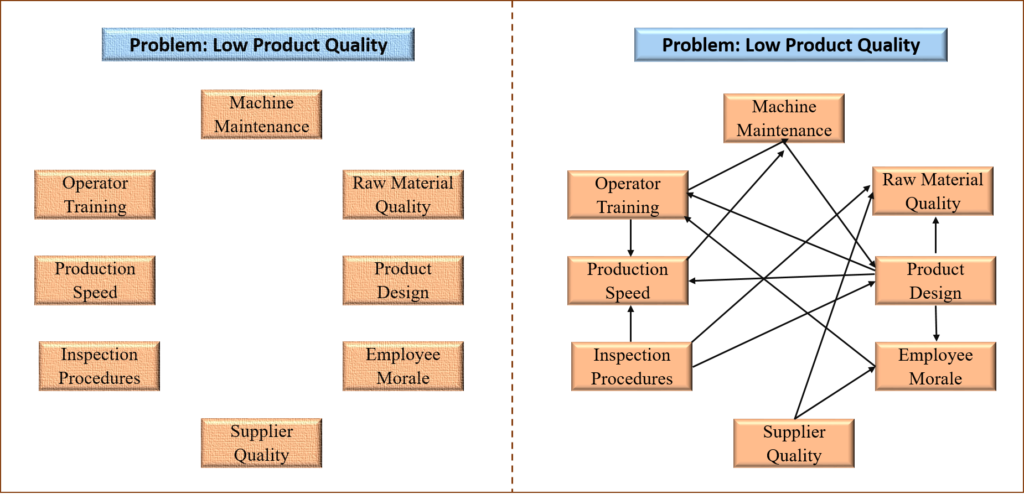
Let us tally up the arrows for each issue as follows:
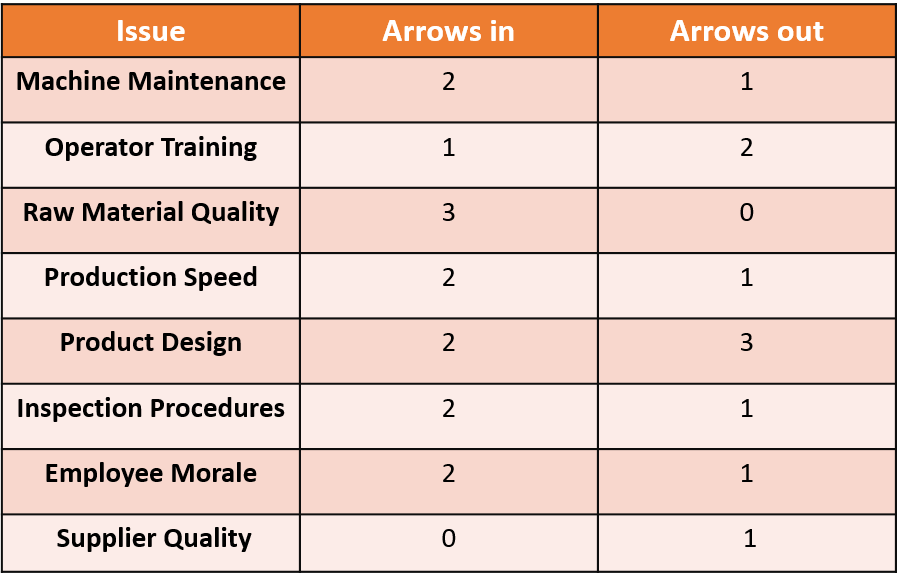
In this case, the interrelationship diagram and tally table would help the company understand how these factors are interconnected and impacting product quality. In this example the main factor responsible for low product quality is due to raw material quality as it has highest number of arrows going in.
6. Conclusion
Interrelationship diagrams serve as a crucial aid in dissecting intricate relationships within complex systems, offering a structured visual representation of cause-and-effect connections between variables. Employed effectively, they enhance decision-making and problem-solving across various domains, shedding light on hidden patterns, identifying critical factors, and facilitating the prioritization of actions. By defining the problem, assessing relationships, and involving diverse perspectives, interrelationship diagrams empower individuals and organizations to unravel the complexity of their challenges, fostering more informed and efficient decision-making processes.