
Interrelationship diagrams are powerful tools that can help us better understand complex systems, relationships, and connections. Although these diagrams seem intimidating at first glance, they are simple. They can provide valuable insights into various fields, such as project management, problem-solving, and decision-making. This comprehensive guide will demystify interrelationship diagrams, explaining their purpose components and how to create one step-by-step. Additionally, we will explore real-life examples showcasing the practical applications of this tool, allowing you to harness its power and enhance your analytical skills. By the end of this article, you will be equipped with the knowledge and confidence to effectively use and apply interrelationship diagrams in your professional or personal endeavors.
Interrelationship Diagram
Also called interrelationship digraph, network diagram, relations diagram, or digraph
An interrelationship diagram is a powerful tool used to analyze and visualize complex relationships between different elements or factors. They are often used in problem-solving, decision-making, and strategic planning processes. At first glance, interrelationship diagrams may look like a web of lines and arrows, but they hold significant value in uncovering a system’s underlying connections and dependencies.
Benefits of Interrelationship Diagrams
- Interrelationship diagrams visually depict cause and effect relationships for system analysis
- Facilitate pattern recognition and identify critical factors impacting the system
- Simplify understanding of complex situations with multiple variables
- Promote effective communication and knowledge sharing among team members
- Encourage a systemic approach to problem-solving and decision-making
When to Use Interrelationship Diagrams?
- Visualizing the process of identifying critical areas for improvement by understanding links between ideas and cause and effect relationships
- Depicting the analysis of complex issues to find root causes
- Illustrating the implementation of complex solutions
- Showing diagrams like affinity diagrams, fishbone, or tree diagrams for exploring the relationships of ideas
- Representing root cause analysis, focusing on how different aspects of a problem are connected and the relationships between problems and their potential causes
Interrelationship Diagram Procedure
1. Start by defining the issue and placing it at the top of your workspace.
2. Brainstorm ideas related to the issue, using previous tools if available (e.g., affinity diagram, tree diagram, fishbone diagram). Write these ideas on cards or notes.
3. Place each idea on the workspace and ask if it’s related to any other ideas. Group related ideas together, leaving space for arrows.
4. Draw arrows from each idea to those it influences or causes.
5. Analyze the diagram by counting arrows in and out of each idea. Write the number at the bottom of each box. Ideas with more arrows are key ideas.
6. Identify ideas with primarily outgoing arrows as basic causes and those with incoming arrows as critical effects.
7. Keep in mind that the number of arrows is an indicator, not a strict rule. Boldly highlight the key ideas.
Interrelationship Diagram Procedure For Root Cause Analysis
1. Identify the factors you want to study and give them concise labels.
2. Arrange these factors in a circular pattern on a whiteboard.
3. Determine how each factor influences others and how it is influenced by them. Use arrows to show these relationships.
4. Count the arrows going in and out of each factor and record this on the diagram.
5. Depending on the arrow count, a factor can be either a driver (influencing others more) or an indicator (influencing more).
6. When doing root cause analysis, start with the drivers.
Tools Required for Interrelationship Diagram
- Interrelationship checklist
- Interrelationship Diagram Template
- Instructions
- Templates
Example of Interrelationship Diagram
Let’s consider an example of a software development company, which is facing declining project completion rates. The company is perplexed because despite having a talented team and good resources, their project timelines are consistently being extended.
To understand the underlying causes and effects, the company decides to create an interrelationship diagram and include the following factors for analysis:
- Developer Workload
- Number of Urgent Bug Fixes
- Documentation Quality
- Changes in Project Requirements
- Tool and Software Reliability
- Support from Other Departments
- Team Collaboration
- Training Opportunities
- Client Communication and Feedback
- Lack of leadership
- Inadequate planning
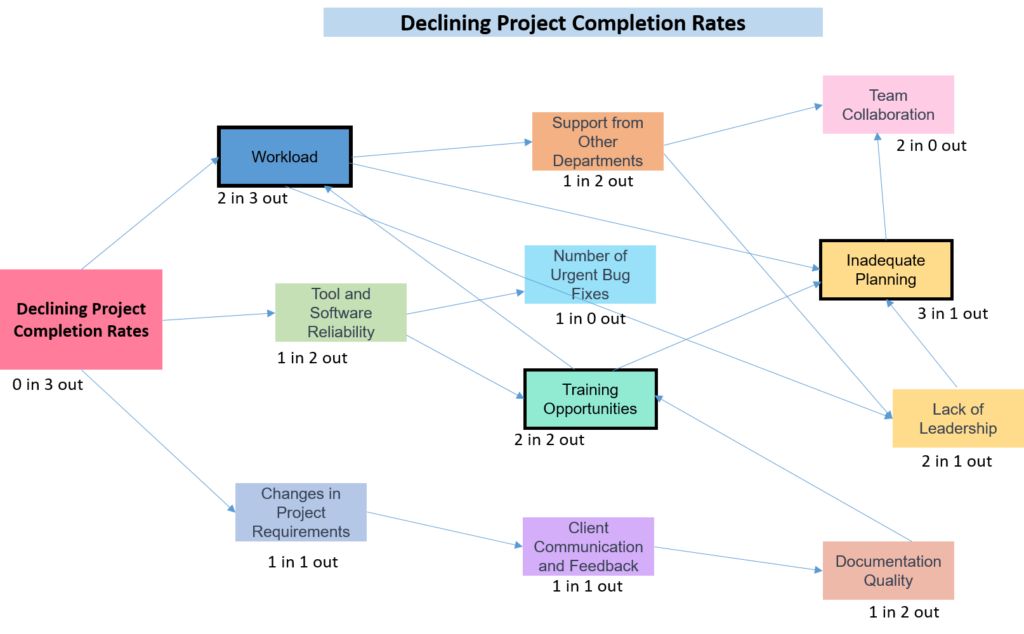
Workload, Training opportunities and Inadequate planning are the fundamental causes as they have the maximum arrows in and out.
- “Workload” has 2 arrows in and 3 arrows out
- “Training opportunities” has 2 arrows in and 2 arrows out
- “Inadequate planning” has 3 arrows in and 1 arrow out
The software development company’s diagram serves as a comprehensive visualization of the intricate web of factors impacting project completion. Each element is interconnected through arrows, signifying relationships and influences. Through this process, the company gains insights into the core issues, shown with bold lines, such as “Workload”, “Training opportunities and “Inadequate planning” as main causes. The interrelationship diagram becomes a powerful tool for the company to systematically analyze and address the root causes and effects, paving the way for strategic interventions aimed at improving project completion rates.