
Regarding problem-solving and process improvement, the Fishbone diagram is a powerful tool to help organizations identify the root causes of issues. Also known as the Cause and Effect diagram, this visual representation allows for a systematic approach to problem analysis. However, many individuals are often mystified by the complexity of this diagram, unsure of its different types, advantages, and drawbacks. In this article, we will demystify the Fishbone diagram by exploring its various types, discussing its pros and cons, and unveiling the six essential categories, known as the 6 Ms, commonly used to analyze causes. By the end, you will have a comprehensive understanding of this valuable problem-solving tool and be equipped to utilize it effectively.
Introduction to the Fishbone Diagram
- The Fishbone Diagram, also known as the Ishikawa Diagram or Cause and Effect Diagram, is a powerful visual tool used in problem-solving and process improvement.
- This cause analysis tool is considered as one of the seven basic quality tools.
- It was first introduced by Kaoru Ishikawa in the 1960s and has since become a widely used technique in various industries.
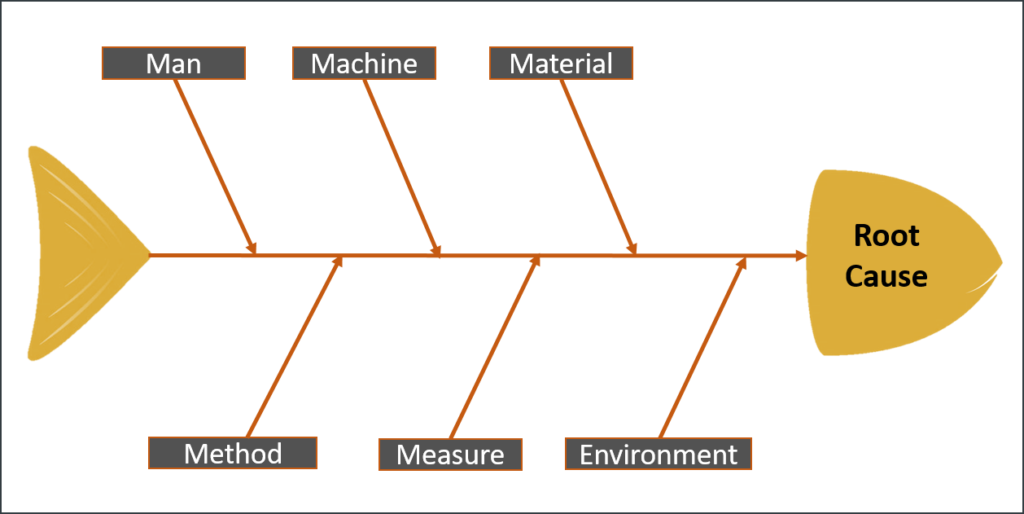
- The Fishbone Diagram gets its name from its shape, which resembles the skeleton of a fish.
- It consists of a horizontal line representing the problem or effect we want to analyze and several diagonal lines branching off from it. These diagonal lines resemble the bones of a fish and represent different categories of potential causes.
- The Fishbone Diagram helps to identify and categorize the root causes of a problem. The brainstorming technique is used to analyze the potential causes.
- It helps in visualizing complex systems or processes, making it easier to identify areas for improvement.
Advantages and Disadvantages of Fishbone Diagram
| Advantages | Disadvantages |
|---|---|
| Visually represents complex relationships and interactions between factors contributing to a problem | Lacks quantitative analysis of causes, making it unable to measure their impact precisely. |
| Promotes collaboration and involvement of team members and stakeholders, leading to diverse perspectives and insights. | Requires time and effort, especially for complex problems with numerous factors and variables, which can lead to frustration |
| Encourages a structured approach to problem-solving by categorizing causes (e.g., 6 M’s), aiding in identification and prioritization. | Can result in a loss of focus if not managed properly during the detailed process of creating the diagram |
Types of Fishbone Diagram
There are various types of Fishbone Diagrams, including the 4 M’s (Man, Machine, Method, Material), 6 M’s (adding Measurement and Mother Nature), and 8 P’s (adding People, Policies, and Procedures). Each type focuses on different aspects of the problem and helps to uncover a specific set of potential causes.
The 4M’s of Fishbone Diagram

A streamlined version of the Ishikawa diagram, known as the 4 M’s diagram, focuses on four critical factors: “man,” “machine,” and “materials” and “method”. This simplified approach is often applied in manufacturing processes where the influence of external factors like “mother nature” is minimal, and there’s less emphasis on constant measurement or refinement. The 4M analysis is applicable in a wide array of environments, spanning manufacturing, service sectors, and healthcare.
The 6 M’s of Fishbone Diagram
- Manpower:
This involves the people responsible for tasks, their skills, training, and competence. It helps identify issues like knowledge gaps or staffing problems.
- Machinery:
It covers tools, equipment, and technology, highlighting issues such as malfunctions or outdated equipment.
- Materials:
This pertains to the quality and availability of raw materials and components, uncovering problems like poor-quality materials or supply disruptions.
- Methods:
It evaluates procedures and processes for efficiency and adherence to protocols, revealing inefficiencies or bottlenecks.
- Measurements:
This involves data, metrics, and KPIs, identifying problems related to data accuracy or inadequate monitoring.
- Mother Nature (Environment):
This considers external factors, workplace culture, and physical conditions, revealing issues like poor communication or unsafe conditions.
The 8P’s of Fishbone Diagram

- Procedures:
These are step-by-step instructions that outline how to complete a specific task or activity efficiently and effectively.
- Policies:
Internal rules and guidelines dictate how various operations are conducted within an organization. It is essential to ensure compliance with these policies.
- Place:
The physical locations where events or activities take place. Evaluating the choice of location can lead to better decision-making and consider the implications of location on outcomes.
- Product:
The item or service being created or offered. Understanding why a product is being produced and exploring alternatives can drive innovation.
- People:
Identifying the individuals involved in a process, ensuring the right people are engaged, and addressing potential omissions.
- Processes:
The series of steps and actions involved in completing a task or achieving a goal. Assessing adherence to these processes helps maintain consistency and efficiency.
- Price:
Examining the financial inputs (costs) and outputs (revenues) of a process or product to understand its financial viability and profitability.
- Promotion:
The strategies and methods used to introduce products to the market and communicate their benefits to potential customers are crucial in marketing and sales efforts.
Fishbone Diagram Procedure
- Define the problem or effect:
Clearly state what you want to analyze and understand the root cause of.
- Draw the fishbone structure:
Draw a horizontal line across the page and extend it with a diagonal line branching out to the right. This will serve as the spine of the fishbone.
- Identify categories:
On each branch of the spine, write down the categories under which potential causes will be listed. These categories may vary depending on the nature of the problem or effect.
- Identify causes:
Brainstorm with a team or individually to identify potential causes for each category. Write each cause as a branch extending from the corresponding category.
- Analyze and refine:
Evaluate each cause and determine its significance and relationship to the problem or effect. You can further break down causes into sub-causes if necessary.
- Identify root cause(s):
Analyze the causes to identify the most influential and critical factors that contribute to the problem or effect. This will help you prioritize your actions for resolution.
Fishbone Diagram Example
A manufacturing team created this fishbone diagram to investigate the root cause of periodic iron contamination. They employed the six generic headings to stimulate ideas, and the multiple branches on the diagram reflect their thorough analysis of potential causes for the problem.

For instance, under the category “Machines,” they listed “materials of construction,” which led to the identification of four equipment types and several specific machine numbers.
It’s worth noting that some ideas appear in multiple places. For instance, “Calibration” is listed both under “Methods” as a factor in the analytical procedure and under “Measurement” as a contributor to laboratory errors. Similarly, “Iron tools” can be viewed as a “Methods” issue when taking samples or as a “Manpower” concern involving maintenance personnel.
Conclusion
In conclusion, the Fishbone Diagram, also known as the Ishikawa or Cause and Effect diagram, is a powerful tool for systematic problem solving and process improvement. It enables organizations to identify and categorize root causes of issues effectively. By exploring its various types, advantages, and drawbacks, we can harness its full potential. Additionally, understanding the six essential categories, known as the 6 M’s, and the extended 8 P’s, allows for a comprehensive analysis of potential causes. Whether addressing production delays in manufacturing or tackling challenges in any industry, the Fishbone Diagram provides a structured approach to problem analysis, fostering innovation and informed decision-making. Through its visual representation, collaboration, and methodical approach, this tool proves invaluable in uncovering and resolving complex problems within organizations.