
Affinity diagrams are widely recognized tools in problem-solving and decision-making that aid in organizing and understanding information effectively across diverse fields. Another notable Lean Six Sigma tool is the A3 Report, as discussed in a previous blog.
In Lean Six Sigma, affinity diagrams function as analytical instruments tailored to sort a plethora of ideas into subgroups by pinpointing mutual themes or relationship . Originating in the 1960s and attributed to Japanese anthropologist Jiro Kawakita, this potent visual aid facilitates the grouping and categorizing of ideas, data, and information, ultimately leading to deeper insights and improved problem-solving.
“Organizing is what you do before you do something, so that when you do it, it is not all mixed up.”
— A. A. Milne
Whether confronted with a complex business challenge, engaged in project planning, or simply seeking a method to structure your thoughts, this comprehensive guide will walk you through crafting and deploying affinity diagrams. By doing so, you can tap into their true potential, revolutionizing your approach to problem-solving. Get ready to harness the complete capabilities of affinity diagrams and unveil new dimensions of clarity and creativity in your endeavors to address challenges.
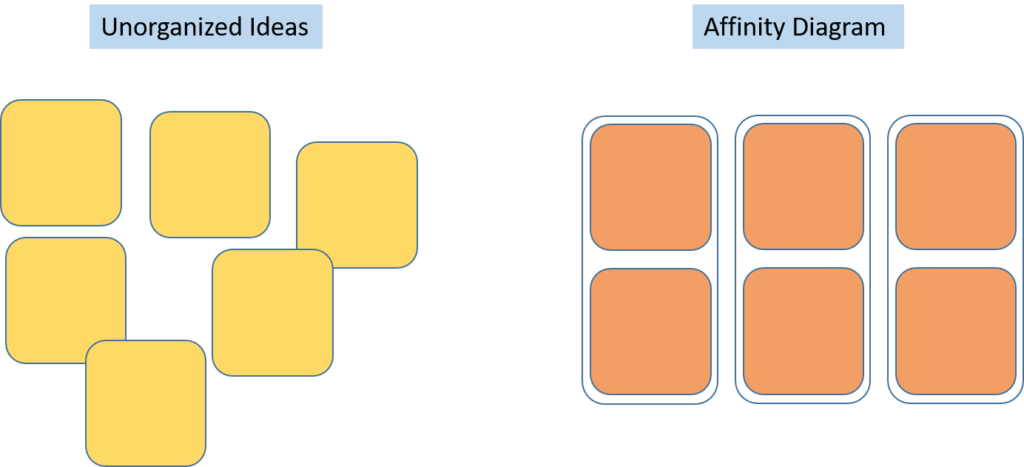
Affinity Diagram (K-J Method)
Affinity diagrams are also recognized as affinity mapping, K-J method or cluster analysis. It is one of the seven management tools that are used in Total Quality Management (TQM). Affinity diagrams serve as a potent tool for addressing complex problems by organizing large number of thoughts into their regular relationship. These diagrams enable individuals or teams to group interrelated pieces of information together, thereby enhancing comprehension and analysis.

The affinity diagram process begins with defining a clear problem and gathering a diverse group of participants. Ideas are generated and recorded on sticky notes, emphasizing quantity over quality. Participants then collaborate to group similar ideas, fostering open communication. These groups are reviewed and refined for accuracy. Finally, the outcomes are documented and visualized for easier analysis and sharing, helping improve insights and problem-solving abilities.
When to use Affinity Diagram
- When you are faced with a jumble of facts and data collections that seems disorganized.
- When dealing with massive and intricate problems that are hard to understand.
- When you need to reach a group agreement or decision.
- When you want to Identify connections or themes among ideas.
- When you want to analyze spoken information like survey responses.
- Sorting out the aftermath of a brainstorming session.
- Simplifying details into broader categories for higher-level consideration.
Step-by-step guide to creating an Affinity Diagram
Creating an affinity diagram can be a powerful way to organize and make sense of complex information. This step-by-step guide will walk you through the process of creating an affinity diagram and harnessing its problem-solving potential.
Step 1: Define the problem or topic
Start by clearly defining the problem or topic you want to address with the affinity diagram. This could be anything from brainstorming ideas for a new project to identifying pain points in a process.
Step 2: Gather and write down ideas
The next step is to gather a group of individuals who can contribute diverse perspectives and insights. Encourage everyone to generate ideas individually and write each idea down on a sticky note or index card. Remind participants to focus on the problem or topic at hand and not to judge or evaluate ideas during this stage.

Step 3: Group similar ideas
Once you have generated all the ideas, you should group similar ideas together. Look for common themes, connections, or patterns among the ideas. Arrange the sticky notes or index cards on a wall or a large workspace, grouping them based on their similarities. It may be helpful to use different colors or symbols to denote different groups.
Step 4: Label the groups
Now that you have grouped the ideas, it’s time to label each group with a descriptive title. This will help provide clarity and structure to the affinity diagram. Use concise and meaningful labels that capture the essence of each group.
Step 5: Analyze and prioritize
Take a step back and analyze the affinity diagram as a whole. Furthermore, Look for recurring themes, identify key insights, and prioritize the groups based on their importance or relevance to the problem or topic. This analysis will help you gain a deeper understanding of the underlying issues and guide your decision-making process.
Step 6: Take action
With a clear picture of the grouped ideas and their priorities, it’s time to take action. Subsequently, Use the insights gained from the affinity diagram to inform problem-solving strategies, develop action plans, or make informed decisions. The affinity diagram serves as a visual guide that can help guide your next steps and drive meaningful change.
Remember, the power of the affinity diagram lies in its ability to bring structure, clarity, and insights to complex problems or topics. By following this step-by-step guide, you can unlock the full potential of the affinity diagram and utilize it as an effective problem-solving tool in your personal or professional endeavors.
Benefits of using Affinity Diagram
- Helps capture and organize diverse ideas, thoughts, and information effectively.
- Facilitates the generation of ideas through various methods like brainstorming, surveys, or interviews.
- Aids in creating a visual representation of ideas by grouping them by commonalities, making complex information more digestible.
- Promotes comprehensive analysis and prioritization of information, leading to informed decision-making.
- Highlights critical areas that need attention or further exploration, aiding in problem-solving.
- Supports teams in arriving at more effective and well-informed solutions by revealing concealed patterns and relationships within complex problems.
- Enhances collaborative efforts by allowing team members to discuss insights and implications of each group, fostering a collective understanding.
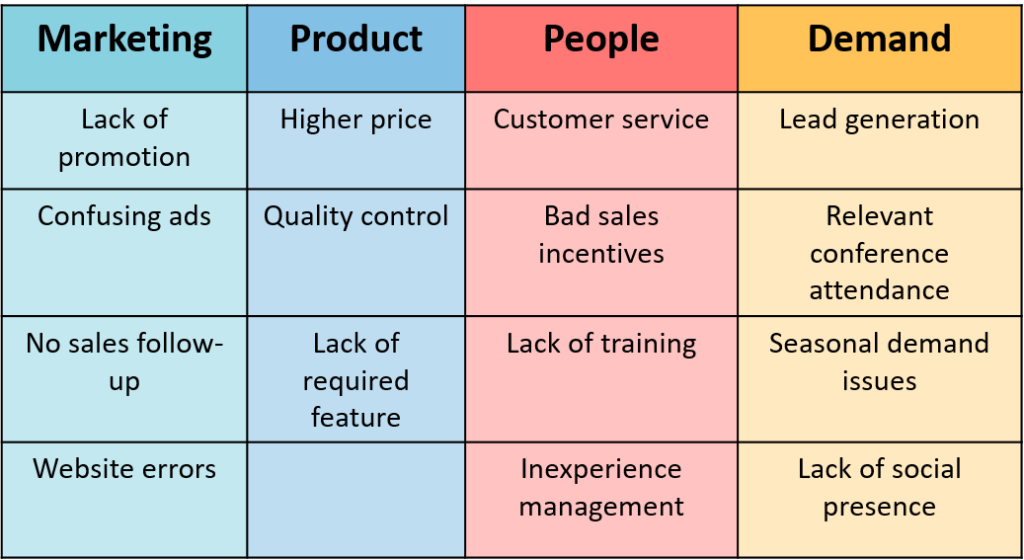
Affinity Diagram Example for Total Quality Management
The following example illustrates how an affinity diagram can serve as a valuable quality management tool to pinpoint issues in management and strategic planning. In this particular instance, we use the affinity diagram to delve into the root causes of low product sales.
Tips for maximizing the effectiveness of Affinity Diagram
To ensure you get the most out of affinity diagrams, there are several valuable tips and best practices to bear in mind:
- Diverse Stakeholder Involvement: Involving a diverse group of stakeholders in the affinity diagramming process is crucial as diverse backgrounds contribute to a more comprehensive and well-rounded problem analysis.
- Open and Honest Communication: Create an atmosphere where everyone feels comfortable sharing their thoughts and ideas without worrying about being judged. This makes it easier for everyone to work together and come up with good solutions.
- Clear and Concise Labels: When organizing the affinity diagram, make sure that each group or category is labeled clearly and concisely. This clarity makes it easier for everyone to understand and navigate the diagram.
- Visual Enhancements: You can use colors or symbols to make the diagram more interesting and easier to understand. Pictures and visuals can help show important information. Graphic elements can help highlight important information and relationships.
- Prioritize and Consolidate: While organizing the diagram, focus on identifying and consolidating similar ideas or themes. Seek out common patterns or recurring issues and group them. This process helps pinpoint critical focus areas and facilitates generating targeted solutions.
- Regular Updates: Affinity diagrams are not static tools; they should be dynamic and continuously updated. Revisit the diagram as new insights and information emerge during the problem-solving process. Regular review and refinement ensure that the diagram remains relevant and practical.
Conclusion
In conclusion, affinity diagrams are valuable problem-solving tools that bring structure to complex challenges. They uncover insights and relationships by involving diverse stakeholders, encouraging open communication, and applying best practices like clear labeling and visual enhancements. Affinity diagrams can be used in various scenarios, from brainstorming to strategic planning, leading to better-informed solutions. To maximize their effectiveness, ensure regular updates and prioritization of critical themes. Harness the power of affinity diagrams to revolutionize problem-solving and decision-making for improved outcomes and clarity in addressing challenges.