Matrix diagrams are a powerful tool in project management and decision making. However, many people find them to be complex and intimidating. In this comprehensive guide, we will demystify matrix diagrams and break them down into simple terms. We will explore the benefits of using matrix diagrams, their various applications across different industries, and the types of matrices that can be utilized. Whether you are a project manager, a business analyst, or someone looking to improve their decision-making skills, this guide will equip you with the knowledge and understanding to confidently navigate and leverage matrix diagrams in your professional endeavors. Get ready to unravel the mysteries of matrix diagrams and unlock their full potential!
Table Of Contents
- Matrix Diagram
- Benefits of Matrix Diagram
- How to make a Matrix Diagram?
- When to use Matrix Diagram?
- When to use each Matrix Diagram Shape?
- Exploring the Different Types of Matrix Diagrams
- Applications of Matrix Diagrams in Different Industries
- Conclusion
Matrix Diagram
Matrix diagram is considered as one of the Seven new Management planning tools.
Matrix diagram is a powerful visual tool for analyzing complex relationships and aiding decision-making in individuals and organizations. These diagrams organize data or information into a grid or matrix format, providing a clear and structured representation of relationships between different variables.
To understand the basics of matrix diagrams, it is essential to grasp the fundamental components. The matrix consists of rows and columns, each intersecting cell representing a specific relationship or interaction. The rows typically represent one set of variables or factors, while the columns represent another set. This arrangement enables the identification of correlations, dependencies, or patterns between the two sets of variables.
Benefits of Matrix Diagram
- Simplifies complex data relationships
- Adaptable to various data types and scenarios
- Enhances collaboration and communication
- Provides a common language for complex information
- Identifies areas for process improvement
How to make a Matrix Diagram?
- Clearly define the intended purpose of the matrix diagram and specify the goals for its creation.
- Collect relevant data, ensuring comprehensive information for analysis.
- Choose the appropriate matrix type based on the defined purpose and nature of the data.
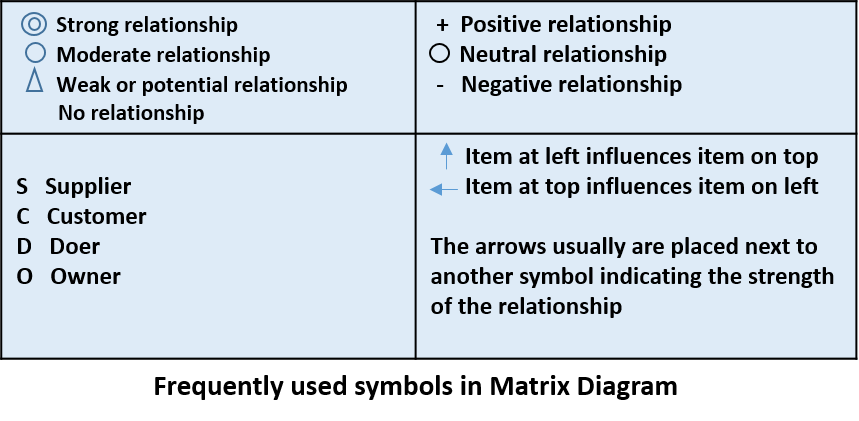
- Collaborate with your team to agree on symbols representing relationship strengths.
- Build a two-dimensional table, placing data sets in rows and columns for matrix construction.
- Analyze relationships between each pair of items.
- Assign weighted scores to indicate the relative importance of items.
- Calculate the final weighted scores for each item based on the analysis.
- Review the completed matrix with your team to make informed decisions.
When to use Matrix Diagram?
- Utilized for Visualizing Complex Interconnections
- Ideal for Spotting Challenges and Areas for Growth
- Effective for Evaluating Different Solutions
- Valuable for Assessing Performance
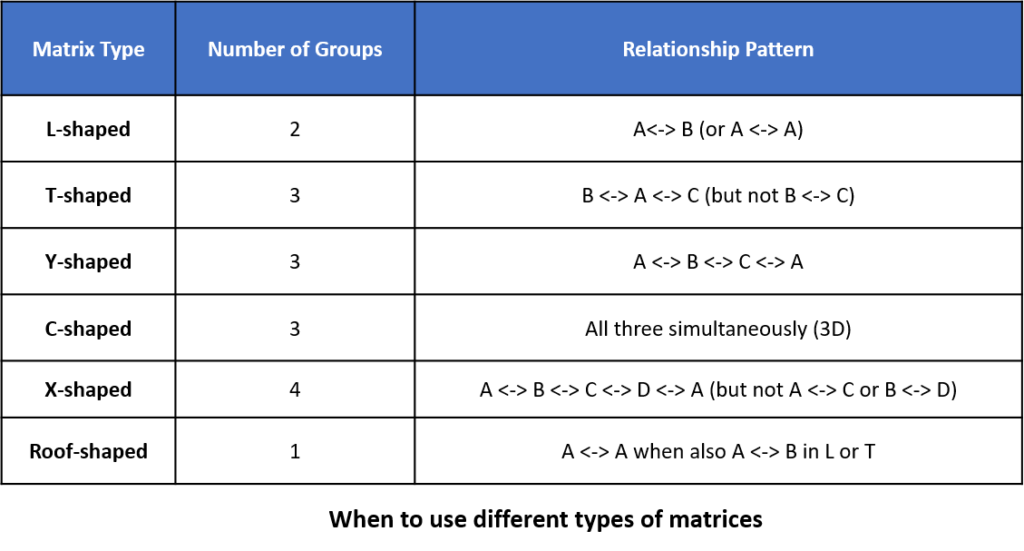
When to use each Matrix Diagram Shape?

- L-shaped Matrix: Use for relating two groups of items or analyzing relationships within a single group.
- T-shaped Matrix: Choose when relating three groups of items, with groups B and C connected to A but not to each other.
- Y-shaped Matrix: Opt for circular relationships between three groups of items, with each group interconnected to the other two.
- C-shaped Matrix: Utilize a 3D representation that relates three groups of items simultaneously.
- X-shaped Matrix: For circular relationships among four groups of items.
- Roof-shaped Matrix: Often used to relate one group of items to itself and can complement an L- or T-shaped matrix for a more comprehensive analysis.
Exploring the Different Types of Matrix Diagrams
L-shaped Matrix Diagram
The L-shaped matrix diagram is a valuable analytical tool used to assess the relationships between two sets of data. Shaping it like the letter “L” allows for a comparative analysis of different factors, facilitating the identification of patterns and correlations. This matrix type finds frequent use in decision-making processes and problem-solving activities, enabling individuals to make informed choices based on a comprehensive understanding of the data.

T-shaped Matrix Diagram
Similar to the L-shaped matrix, the T-shaped matrix diagram expands the scope of analysis to consider three sets of data simultaneously. This makes it particularly useful in situations involving complex systems or multiple variables. It is a versatile tool for comprehensively assessing the relationships between various factors, aiding in more in-depth decision-making and problem-solving.
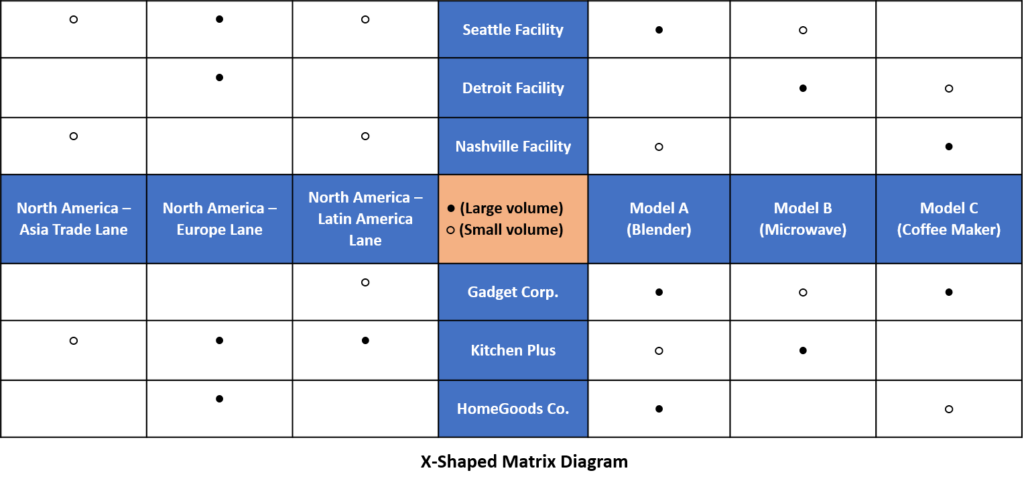
Examining the matrix (below) in different ways reveals different information. For example, focusing on model A shows that it is produced in large volume at the Seattle Facility and in small volume at the Nashville Facility. Gadget Corp and HomeGoods Co. . are the major customer for model A, while Kitchenplus buys a small amount. Focusing on the customer rows shows that only one customer, Gadget Corp, buys all four models.

Y-shaped Matrix Diagram
The Y-shaped matrix diagram takes the analysis further by accommodating four sets of data, offering a detailed examination of the interdependencies between multiple factors. This type is commonly employed in project management, risk assessment, or quality control processes, where understanding the complex relationships among various variables is crucial for success.
C-shaped Matrix Diagram
C-shaped matrices are used to visualize the relationships between two sets of interdependent or interconnected data. Businesses often use them in supply chain management or business process optimization to gain insights into the flow of information, materials, or resources, aiding in efficiently managing resources and processes.

X-shaped Matrix Diagram
The X-shaped matrix diagram represents an advanced form of matrix analysis, handling five or more sets of data. It is often utilized in complex research studies, large-scale organizational analyses, or multi-dimensional data modeling, where an intricate understanding of multiple data relationships is essential for making informed decisions and optimizing processes.

This illustration evolves the concept of a T-shaped matrix into an X-shaped configuration by integrating the connections between transportation networks, manufacturing locations, and their respective clientele. Each arm of the matrix is connected to its immediate neighbors but not to the one directly opposite. Consequently, the product models have associations with both the production sites and the customers but are unconnected to the transportation routes.
Roof-shaped Matrix Diagram
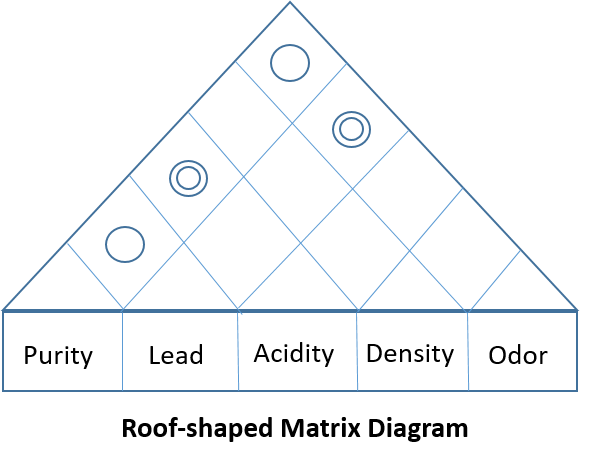
The roof-shaped matrix, typically employed with an L or T-shaped matrix, demonstrates how one group of items relates to itself. It is frequently utilized in a House of Quality, where it serves as the “roof” of the structure. In the illustration below, it reveals the connections among customer requirements. For instance, it highlights a strong relationship between color and trace metals, whereas viscosity remains unrelated to the other requirements.


Understanding these different matrix diagrams empowers individuals to select the most appropriate tool for their needs, whether exploring relationships, making decisions, or managing complex systems. Each matrix type offers unique advantages for data analysis in various contexts.
Applications of Matrix Diagrams in Different Industries
| Project Management | Matrix diagrams are crucial in project management, simplifying task relationships, resource allocation, and dependencies for efficient execution. |
| Quality Management | Matrix diagrams in quality management, like the C&E matrix, identify problem causes and prioritize them by impact, enabling effective efforts and targeted solutions. |
| Risk Analysis | Matrix diagrams, like the RPI matrix, prioritize risks by likelihood and impact for effective mitigation and proactive risk management. |
| Decision-Making | Matrix diagrams enhance objective decision-making across contexts by structuring the comparison of alternatives based on multiple criteria. |
| Supply Chain Management | Matrix diagrams in supply chain management optimize inventory and supplier relationships through supplier evaluation matrices, aiding in selecting and maintaining strong suppliers. |
| Human Resources | Matrix diagrams in HR assess performance and potential, identifying high-potential employees for talent development and succession planning, and enhancing talent and leadership readiness. |
Conclusion
In summary, matrix diagrams are a potent tool for simplifying complex data and uncovering key relationships across different variables. They serve a wide range of applications from project management to decision-making. By choosing the appropriate matrix shape i.e., L, T, Y, C, X, or roof shaped matrix, users can tailor the diagram to their specific needs, enabling clearer analysis and communication. The result is a more structured decision-making process that can significantly improve outcomes in any industry.
